The Price Action System
Previous  Next

System #5 September 2025: Price Action System with indicators II (for mid-term traders) - Recommended system
This system uses some indicators, and geometry. Use it at your own risk.

- Fibonacci Rotated rectangle (Fib Channel) (between 1.618 and 1.786) on Daily TF
- Price above/below Anchored VWAP channel top/bottom of channel with all bars on daily or more TF (useful because it is self similar on all timeframes)
- Spud2 >=90 or <=10 on Daily TF (use it imperatively)
- Useful tip (use it imperatively) : use the Time Series Forecast (TSF 225) indicator on Daily or Weekly charts (increase bars back of the indicator and display 999 bars.) And draw "Gann Fan" or "Fibo Fan" or Gann Grid or (...) between Bottom/Top Bottom/top of the TSF curve in order to find turning points efficiently. Or with Fibo Retr., pentagram between bottom and top of TSF.
- 1 Harmonic pattern detected with Harmonic-Patterns, Search Patterns or Zup indicators (not always necessary)
All the best

System #4 June 2024 (epuration of the system #3)

Entry on 60 or 240 minutes TF, you should verify that the price is on top/bottom with:

Only what's in bold below is important (QChartist's Magic Hat Trick)

graphic
- Murrey Math +-2/8
- Always use TD Sequential >= 9
- Always wait for Weekly R1/S1 at least before entering
- RSI >=70 or <=30
- Useful tip (use it imperatively) : use the Time Series Forecast (TSF 225) indicator (increase bars back of the indicator and display 999 bars.) And draw "Gann Fan" or "Fibo Fan" with price mirror setting between Bottom - Top of the TSF curve in order to find turning points efficiently. Or with Fibo Retr., pentagram between bottom and top of TSF. (never enter if the line of pentagram that converges with the price is too vertical, only accept when the line is almost horizontal)
- (( Circle given 3 points with Gann Fan or Gann Square on the quarters (cf. Michael S Jenkins and Scott Hathaway)) or (drawing tools from system #3 example fibo diamond))
- Anchored VWAP channel daily or Weekly with all historical data available
- Sharpe Ratio indicator >=5 or <=-3 on one timeframe, for example on 30 minutes
- Ma Chanel FiboEnv Mid last band on 5 min TF or TSF with drawing tools

Exit: BB 5 min tf middle band

Then here is an idea to confirm your entry and follow your position:

Combining a Fast Fourier Transform (FFT) with the Hurst Cycles Spectrometer can be more powerful than using either one alone.
If your FFT and Hurst Cycles Spectrometer outputs are synchronized meaning they both highlight the same dominant cycle lengths at the same time that's a pretty strong signal in cycle analysis.
Both indicators are available for QChartist (separate canvas) fftspectro and spectrometer and fft spectogram

All the rest is optional:

- Zup or Harmonic Patterns or Search Patterns (optional)
- Wolfe Waves with Zup (optional)
- ATR Chanels
- Ma Chanel Fibo Env Mid
- BB-HL
- Din Fibo High
- tsi indicator near 80 / -80
- spud2 near 90 / 10
- cyan_1 near 0.8 / -0.8
- Anchored VWAP channel
- VegasCpp Risk Model: always 1, fit the Point: to e.g. 0.000001 for ZERO, 0.001 for FTT so that the first orange line channel is near the current price (top for Ma Chanel Fibo Env Mid) and so that we will enter at the last (third) orange line channel (see ZEROUSDT60 and FTT pictures)
- It is also advised to use the Fibonacci Rotated rectangle method 1 or 2 in Settings (between 61.8 and 78.6) in complement to these indicators (see POPCAT and CVC examples of use)

For your entry, you should also verify that the price is on top/bottom on 5 or 15 minutes TF for confirmation with:
- BB-HL
- Past Regression Deviated Log 500
- ATR Chanels
- Din Fibo High
- Bolinger Bands 20
- Ma Chanel FiboEnv Mid

Always use a low leverage (1x without Vegascpp, 3x max with Vegascpp third band)

Exit: On 5 minutes or 15 minutes TF:
- Bollinger Bands 20 : price is near the Middle band

To find potential signals, check and sort your list of instruments by their % change for the last 24h or 7days

Also, take drastic mesures to avoid losses and liquidation:
--> Never use leverage or use minimum leverage x1 = less risk of liquidation
--> Use only a small part of your capital to invest (max 1/3)
Enter with another 1/3 in the market if you are in difficulty (no leverage or x1)
Enter with the last 1/3 in the market if you are very in difficulty (no leverage or x1)
--> Never close your position at Market Price because you will often loose money when you scalp, always use a TP (target price) or a SL (stop loss) to exit your trades
Application example: First enter 1 position without Vegas indi (with all other indis) with leverage x1 or minimum lev. with 1/3 of capital, then if you are negative, wait for the price to reach the third orange line of Vegas and enter another 1/3 of capital with a higher leverage. If you are still under water, wait for a higher/lower extremum and enter with 1/3 of capital.


graphic

graphic
graphic

graphic

graphic

graphic

Some geometry fibo rotated rectangle in complement to channels indicators :
graphicgraphic

Another good application example of the system #3 and #4 : Analysis of the exotic pair Celo/Blz
- We use some of the fundamentals of the system #3 and system #4 for this analysis
- We never use leverage to avoid risk
- We create the exotic pair Celo/Blz 60 min with the Mixer tool of QChartist first
- We use the timeframe multiplier (60 min x 5) and the Attribute Timeframe function

graphic
graphic
graphic

System #3 November 2022: Price Action System with indicators
This system uses some indicators, and geometry in option. It will give you more opportunities. Use it at your own risk.

Here are the following objects that you can use:
(the more objects you can draw efficiently, the more reliable will be your signals)
Works well on Forex, Indices, Crypto and Commodities.
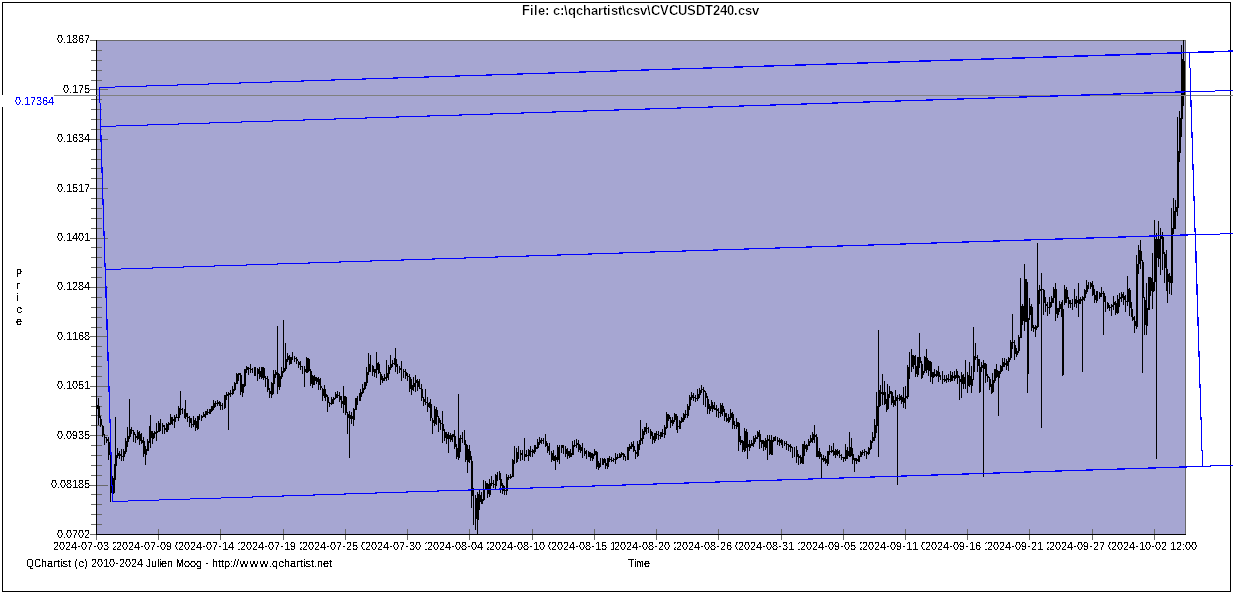
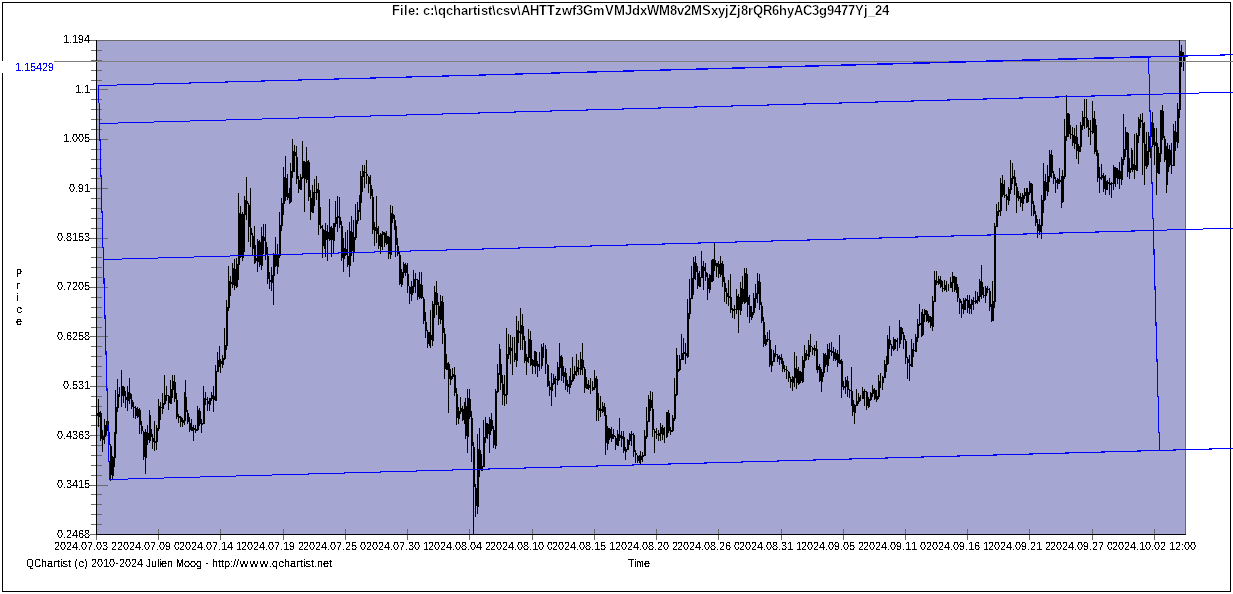
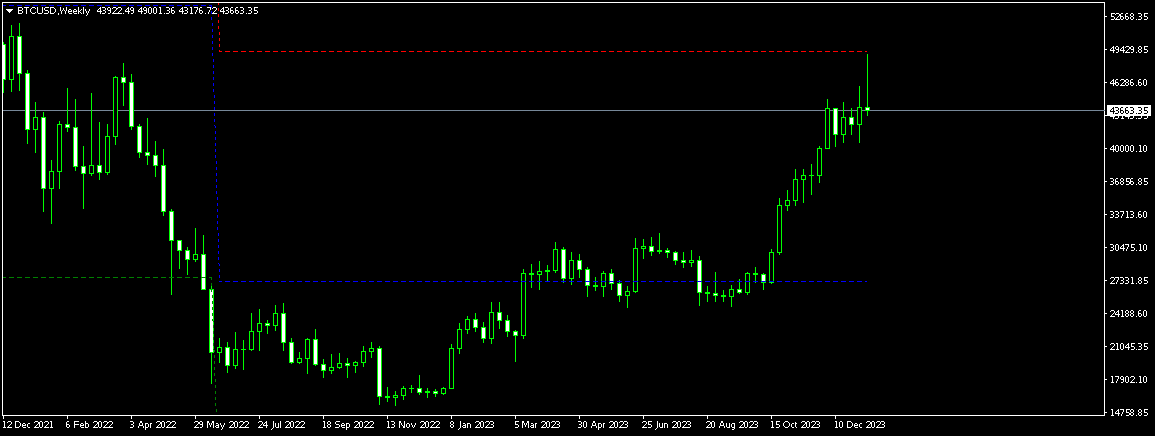
We use Daily or Weekly charts with maximum number of bars (about 1000 bars).
We use scale independant drawing tools, here is the list:
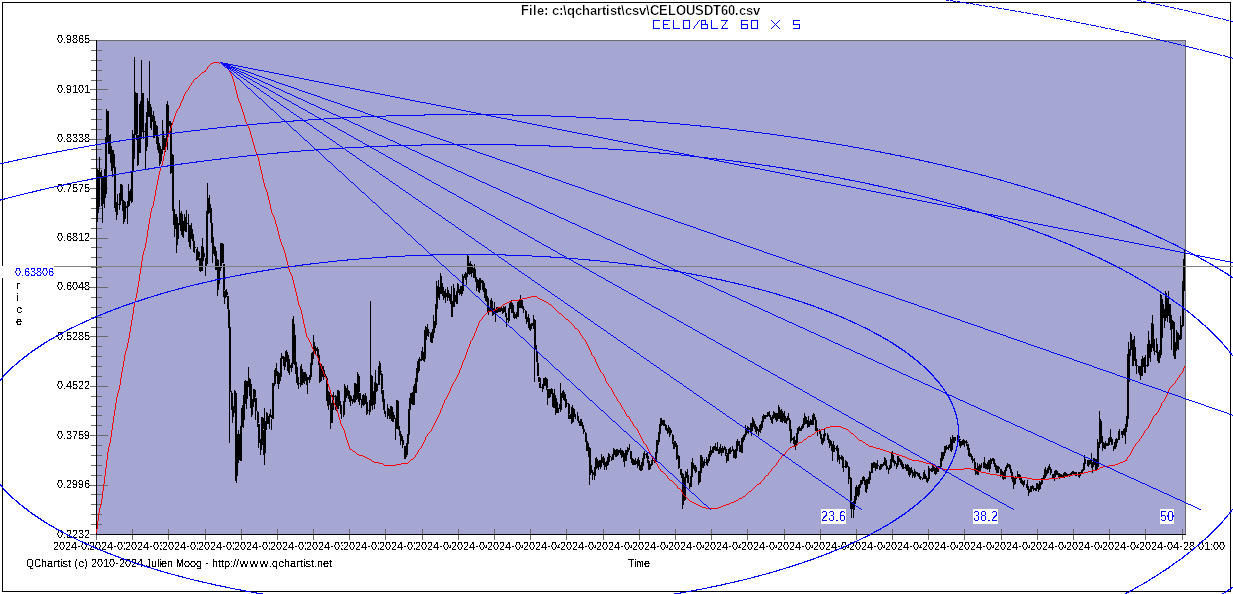
- Trendlines
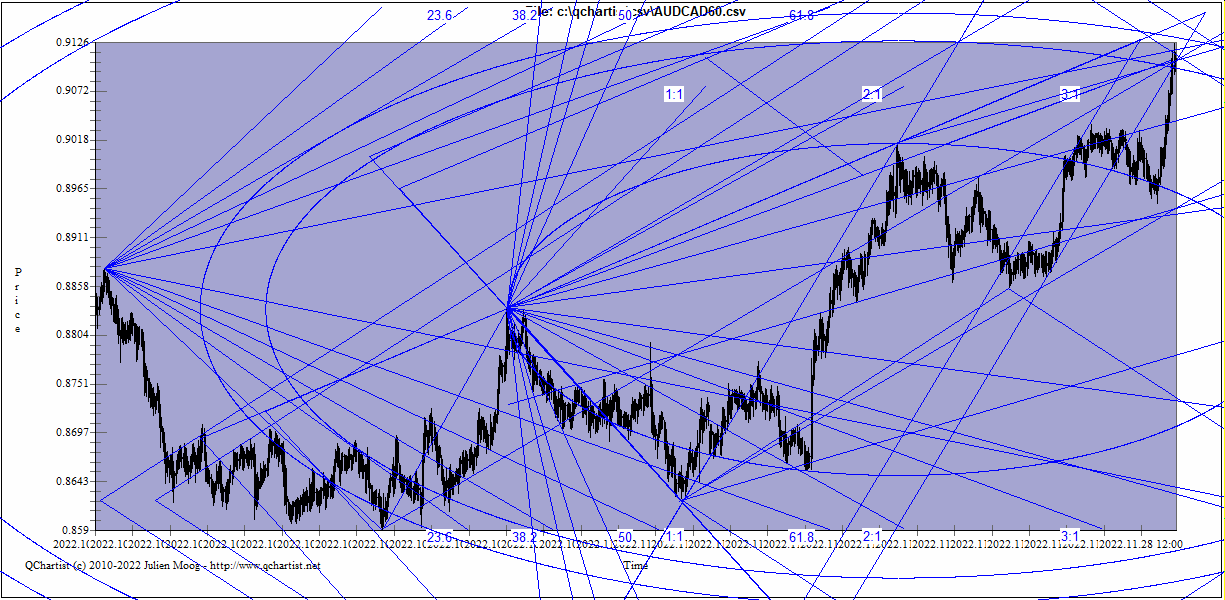
- Fibonacci Retracements (between 61.8 and 78.6)
- Parallel lines (use it imperatively)
- Ellipse (between 61.8 and 78.6)
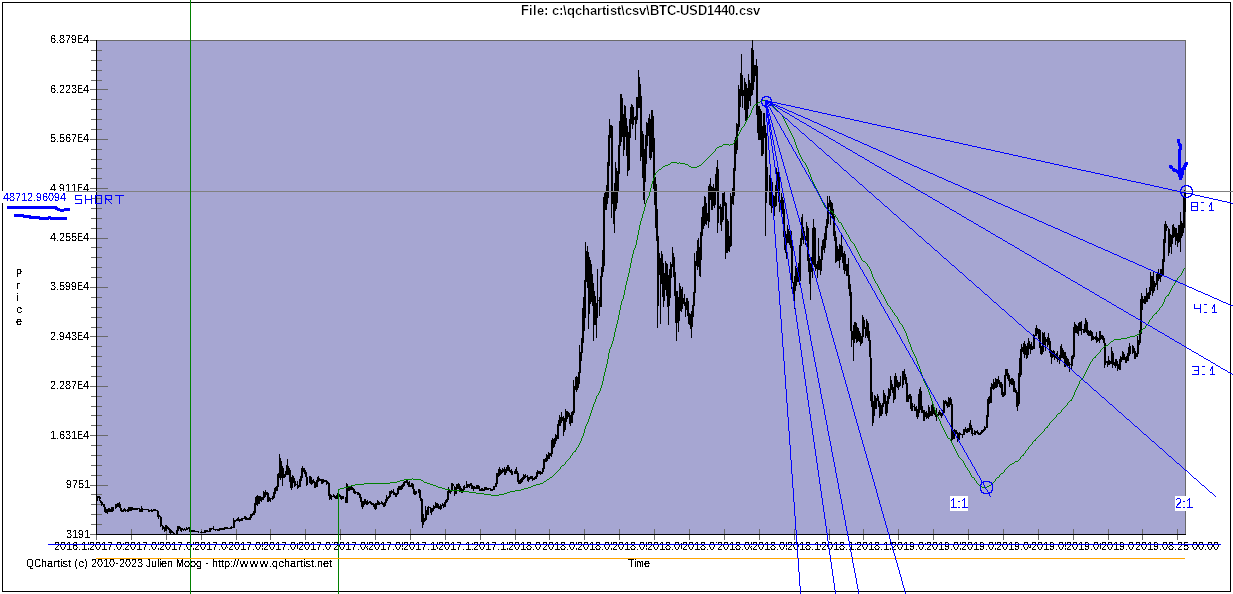
- Andrew's Pitchforks
- Schiff Pitchforks or modified or inside in Settings
- Fibonacci Fans (with price mirror setting) (between 61.8 and 78.6)
- Speed Resistance Lines (with price mirror setting)
- Gann Fans (with price mirror setting)
- Gann Grids
- Oriented Cycles
- Fibonacci  Triangle from 3 points (between 61.8 and 78.6)
- Fibonacci Rectangle method 1 or 2 in Settings (between 61.8 and 78.6)
- Fibonacci Diamond (between 61.8 and 78.6)
- Fibonacci Rotated rectangle method 1 or 2 in Settings (between 61.8 and 78.6)
- (Hathaway https://help.optuma.com/kb/faq.php?cid=21 https://help.optuma.com/kb/faq.php?id=423) Triple Vector Concentric Circle + Drawing Tool from the Center of the Circle (or Parallels or Trend Line at 32.70° (= 90° - 1 Radian))
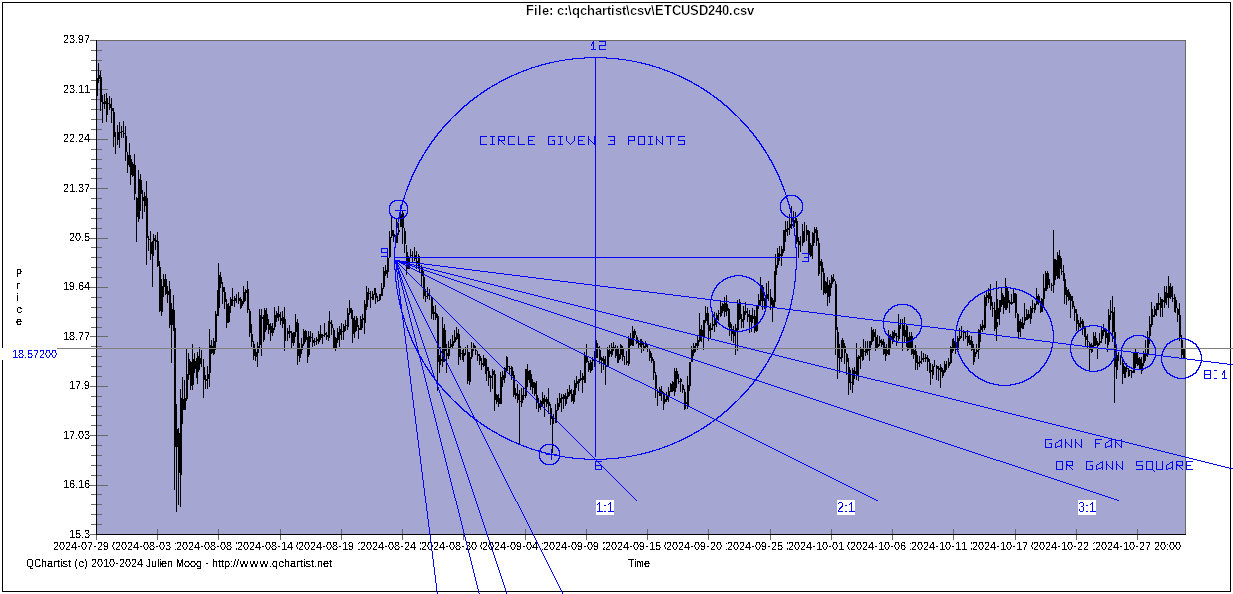
With the "Circle Given 3 Points" drawing tool.

- Moreover, we can also use scale dependant drawing tools to complete the analysis

Here are the indicators that you can use:

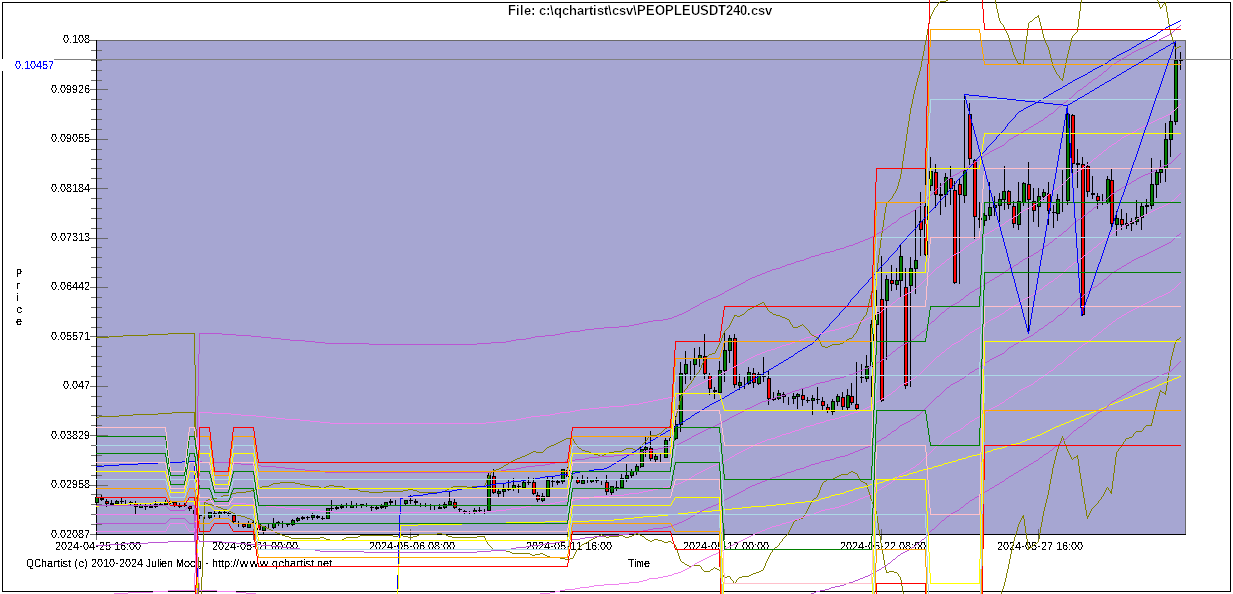
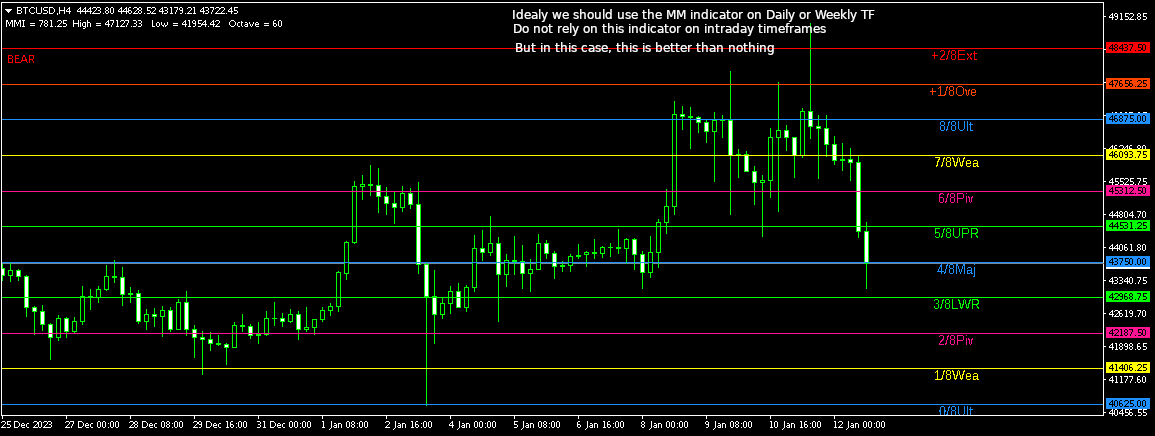
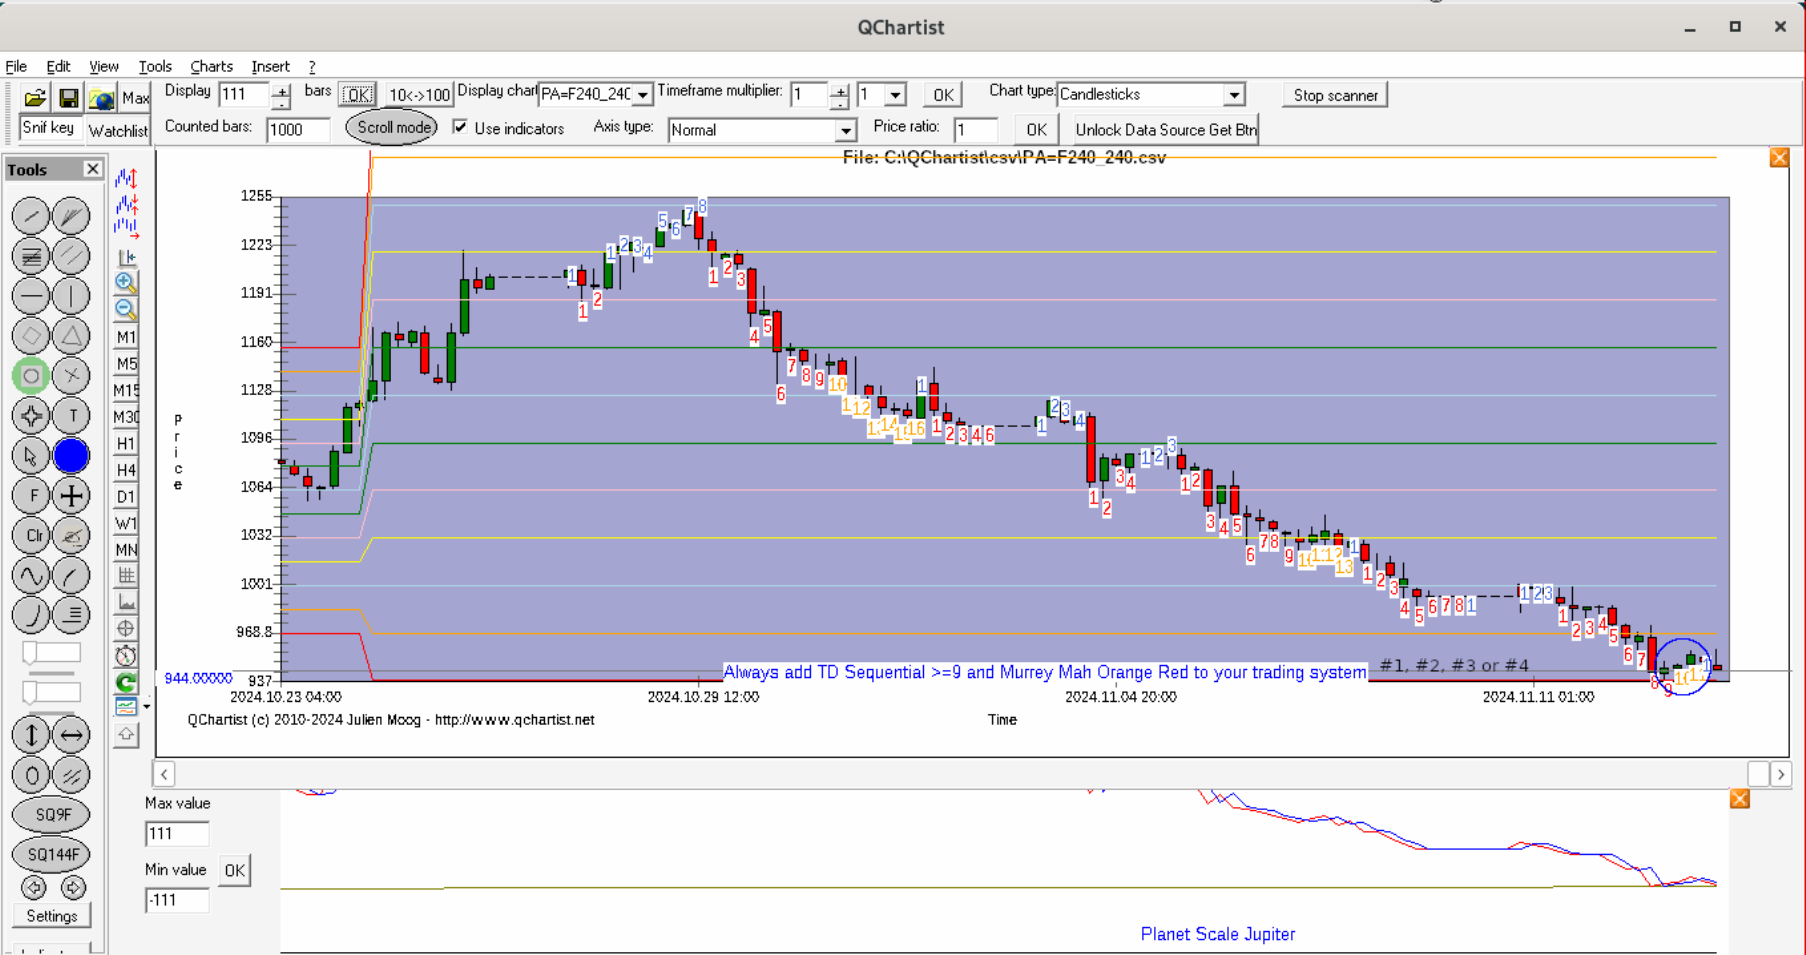
- Murrey Math Daily or Weekly red lines (use it imperatively)
Use it on 4H TF only if you trade indraday (use it imperatively)

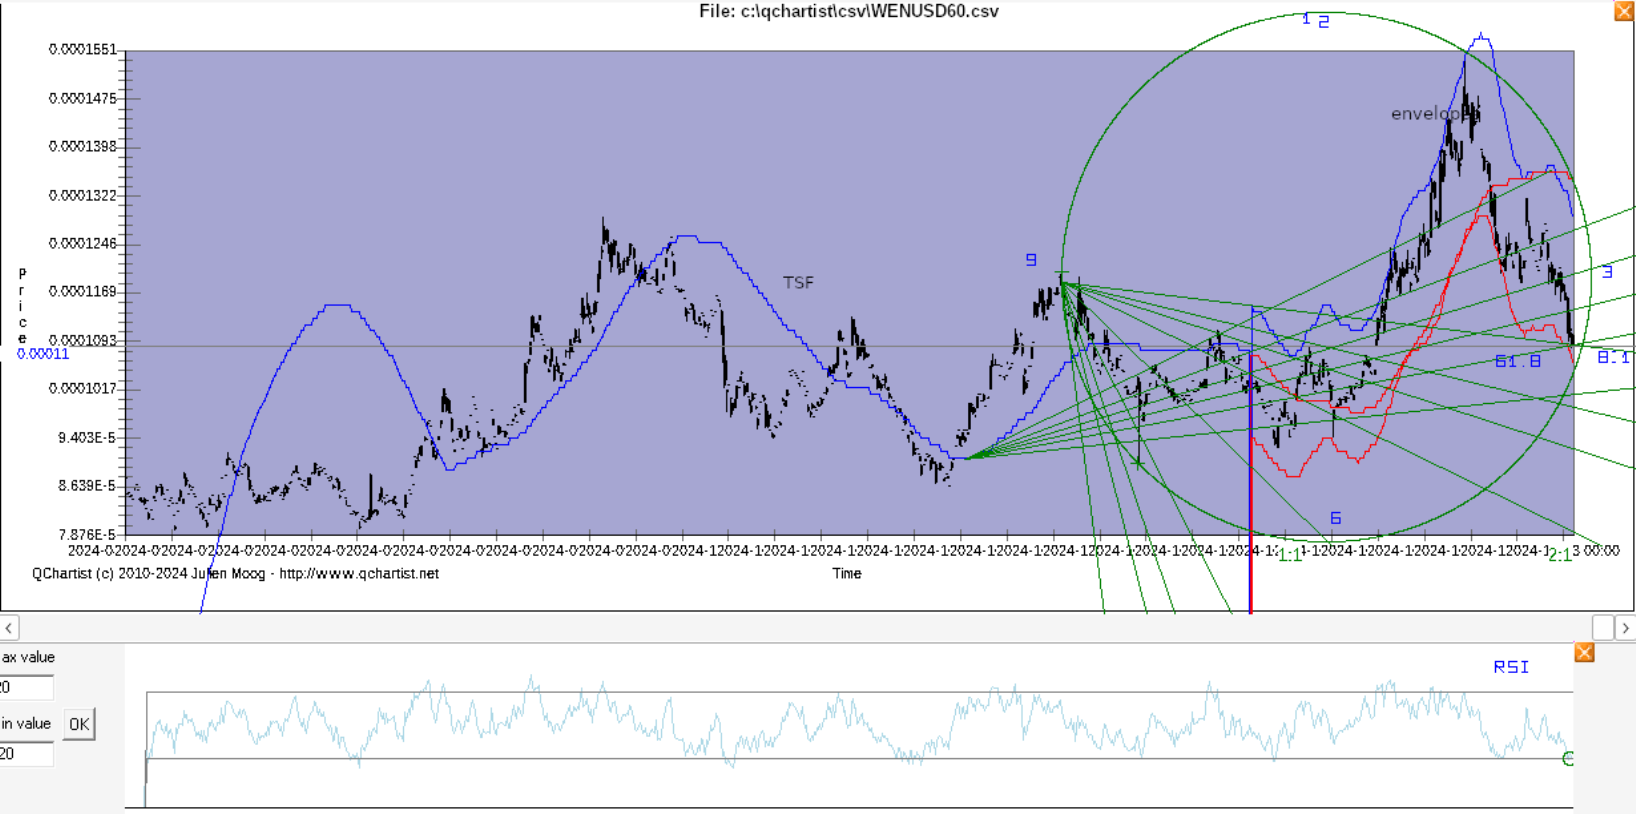
- DVI_Valuechart OR TSF 225 (see Useful tip below) Daily or Weekly with drawing tools (optional if intraday)

- Average Monthly Range (ADR 1.13) near pink or light blue line (optional)

- Center of Gravity and Past Regression Deviated 225 on Monthly chart (optional)

- Useful tip (use it imperatively) : use the Time Series Forecast (TSF 225) indicator on Daily or Weekly charts (increase bars back of the indicator and display 999 bars.) And draw "Gann Fan" or "Fibo Fan" with price mirror setting between Bottom - Top of the TSF curve in order to find turning points efficiently. Or with Fibo Retr., pentagram between bottom and top of TSF. (optional if intraday)

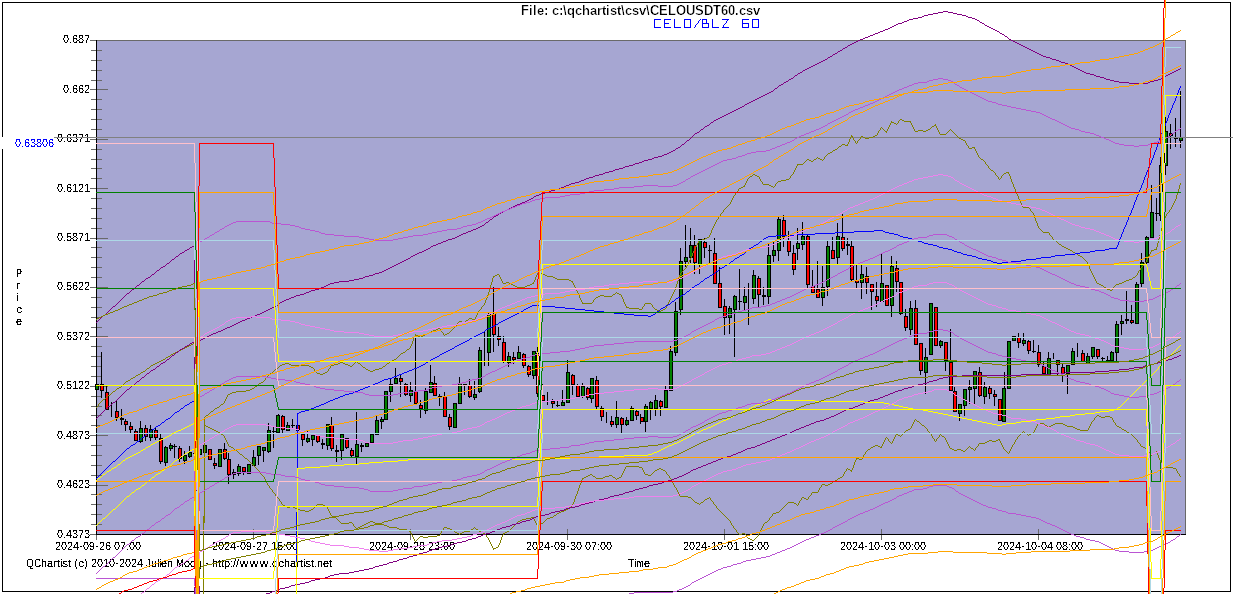
- Another powerful tool to complete the analysis is the use of the chart type Sinusoidal in the Menu Edit > Chart Conversions > Convert chart to Sinusoidal. On the sinusoidal chart (varying from -1 to 1), we use all scale dependant and independent drawing tools to complete the analysis. (optional)

- You can also use the Planet_Scale indicator on Weekly TF to find turning points. (optional)

- MogalefBands4 Daily, Weekly or Monthly (optional)

- Harmonic Patterns, Zup, Search Patterns indicators (useful)

- Anchored VWAP channel top/bottom with all bars on 4H or daily TF (useful because it is self similar on all timeframes)

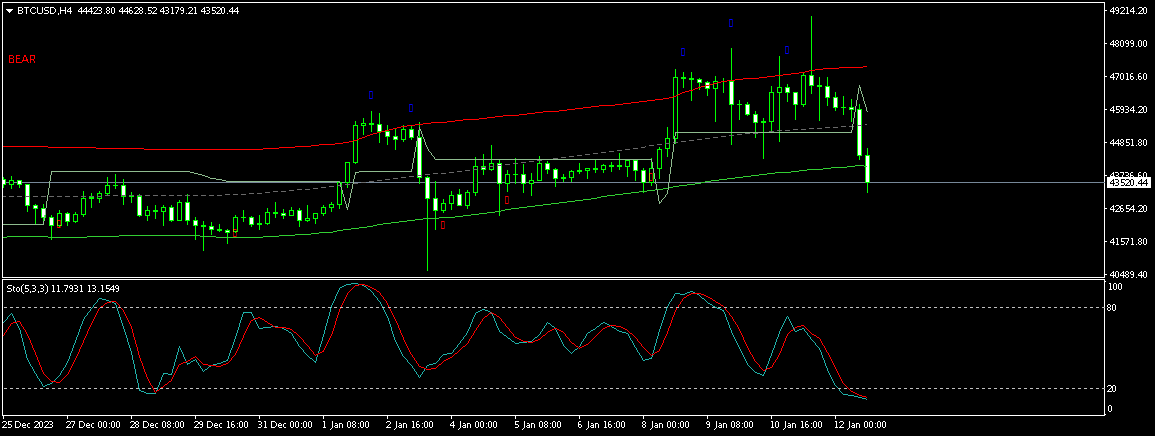
- Stochastic RSI (5,5,5) near 1/-1 on 4H TF (use it imperatively)

- CoronaTrendVigor Max/Min Flat -10/10 on 1H TF (use it imperatively)

- Spud2 >=90 or <=10 on 4H TF (use it imperatively)

- Price is near higher or lower band of DinFiboHigh cpp indicator on Daily TF (use it imperatively)

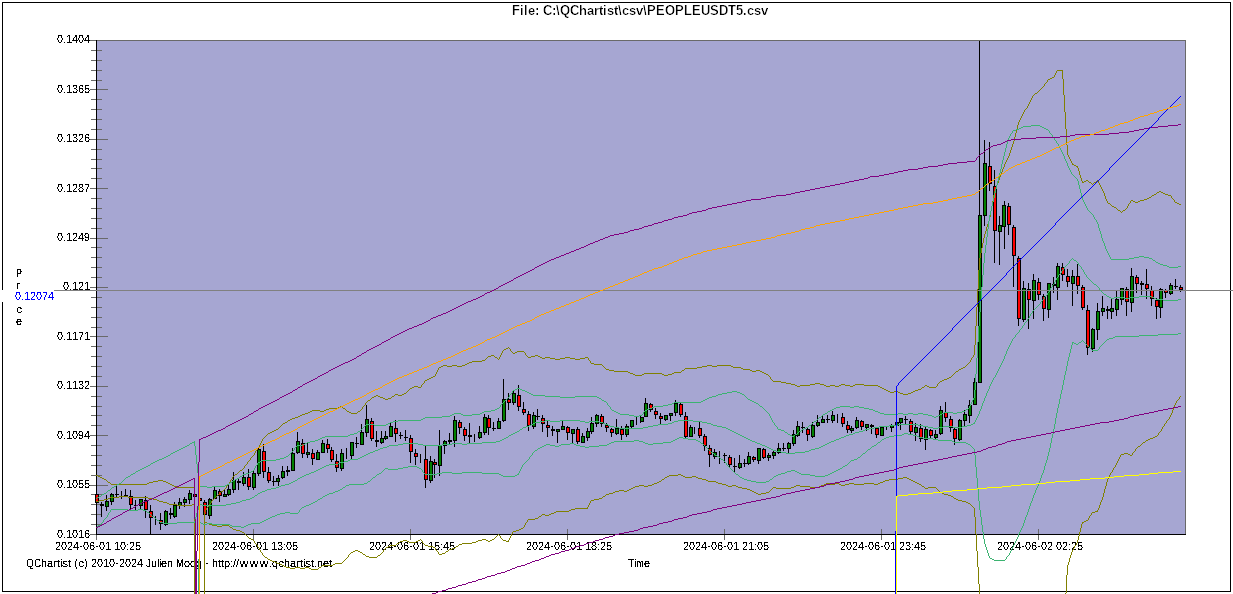
- You should also verify that the price is on top/bottom of Bollinger Bands and BB-HL and ATR Channel and Ma Chanels FiboEnv Mid and Din Fibo High and Past Regression Deviated Log on 5 min TF (use it imperatively)

- You should also verify that the price is on top/bottom of ATR Channel and Ma Chanels FiboEnv Mid indicators on 4H TF. (use it imperatively)

Exit when price is near Volatility.Pivot or when valuechart indicator is near 0 on 4H TF. Or when price is near BB middle band on 4H TF.

- If the price goes into the wrong direction, we wait for the price to reach the Murrey Math indicator +- 2/8 Ext Red Line on the 4H (240 minutes) timeframe ; and we enter again at that market price.

More risky : Exit when price reachs the upper/lower or middle band of TMA_CG indicator on 4H (240 minutes) timeframe. Or when price gets closer to the Volatility.Pivot Indicator. Or with stochastic 5,3,3.
If you want to trade on intraday timesframes anyway, use the valuechart indicator (when value is near 4/-4) as exit signal. This indicator is more sensitive to price changes.


graphicgraphicgraphic

graphic

graphic

Very powerful: Circle given 3 points with Gann Fan or Gann Square on the quarters (cf. Michael S Jenkins and Scott Hathaway):
graphic
graphic
Please always use TD Sequential >= 9 and Murrey Math in your system #1, #2, #3 or #4
graphic
graphic