Disclaimer: this website and all its content is for informational purposes only. Not investment advice.
System Sync
A highly profitable trading system by Julien Moog
This system will give you profitable signals on any markets. You can use the free MetraTrader 4 software and copy all
the following indicators and templates into the software. Or you can also use the free QChartist software.
This system is the fruit of many years of market research and efforts.
This system is complex, signals may be rare, but are very accurate and reliable.
First download and install MetaTrader 4 and configure it with the broker of your choice.
Brokers is recommend: Oanda MT4 demo account, JFD Brokers MT4 demo account, FXPro MT4 demo account and eToro real account to operate.
List of MT4 indicators needed:
- Vegas Currency Daily 1 Hour2
- ADR lines Shinigami v1.1
- ADR lines Shinigami v1.12
- ADR lines Shinigami v1.13
- ATR_Channels
- BB - HL (Per=200)
- bowels
- Center of Gravity 1
- Center of Gravity
- fibo
- fibo2
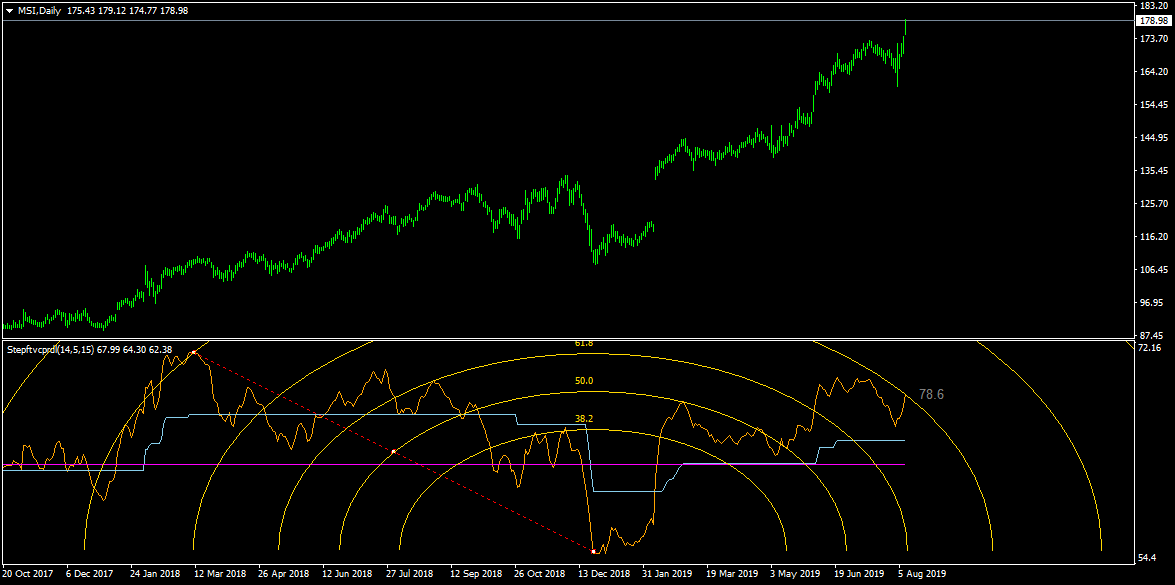
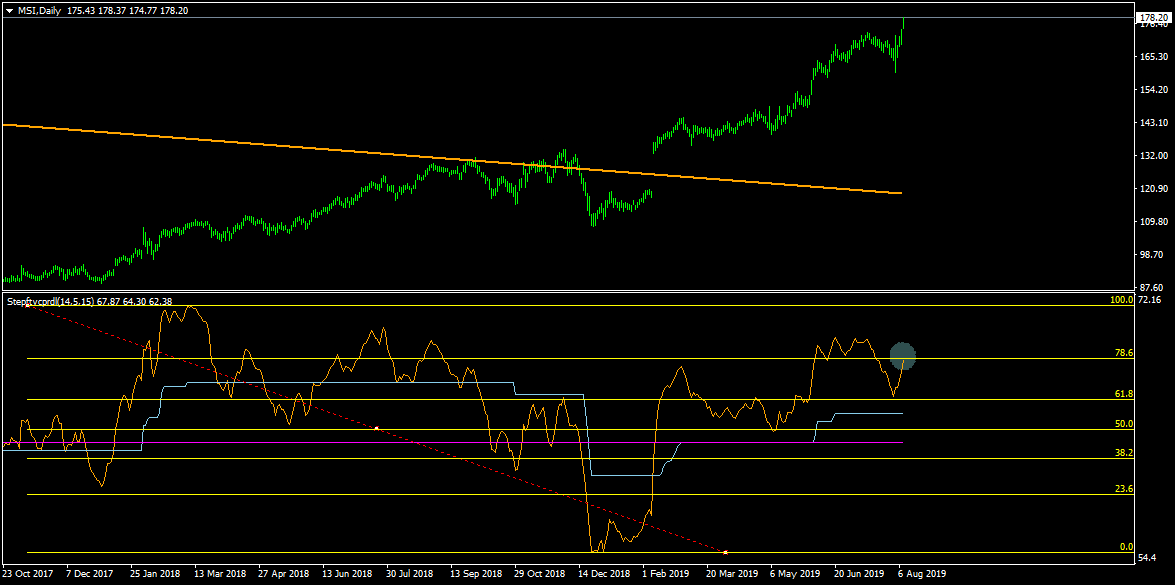
- ftvcprdl
- Ichimoku
- j_tpo
- MA Chanels FiboEnv Mid
- Murrey_Math_MT4_VG
- Past Regression Deviated (LR.length=225)
- Past Regression Deviated Log
- realMACD
- Spectrometr_Separate
- Stepftvcprdl_v2
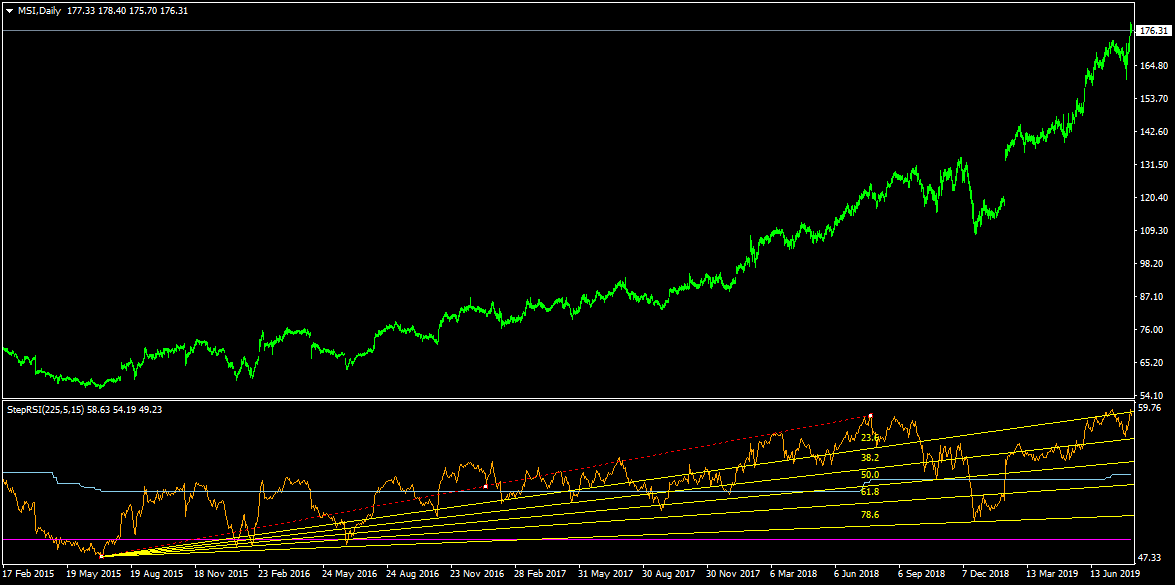
- StepRSI_v2
- Stochastic (5,3,3)
- StochasticRSI (RSILength=5 ; StocLength=5 ; WMALength=5)
- TD Sequential
- TMA (TimeFrame=60 and 240 ; Interpolate=false)
- TMA+CG (Interpolate=false and all alerts false)
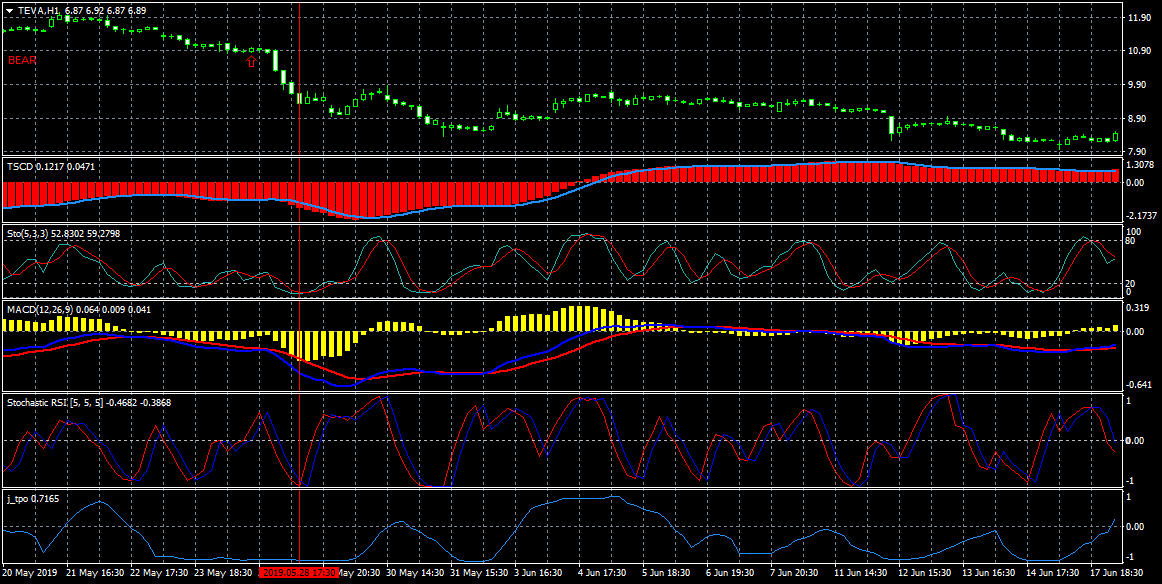
- TSCD
- valuechartatrchannels
- Volatility.Pivot
- VWAP Oscillator
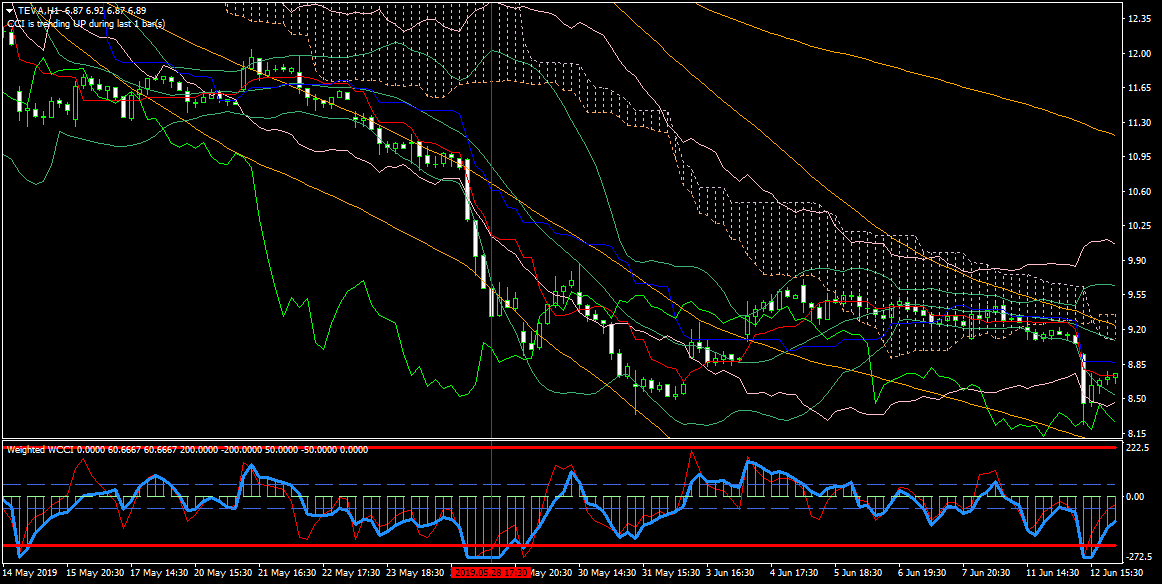
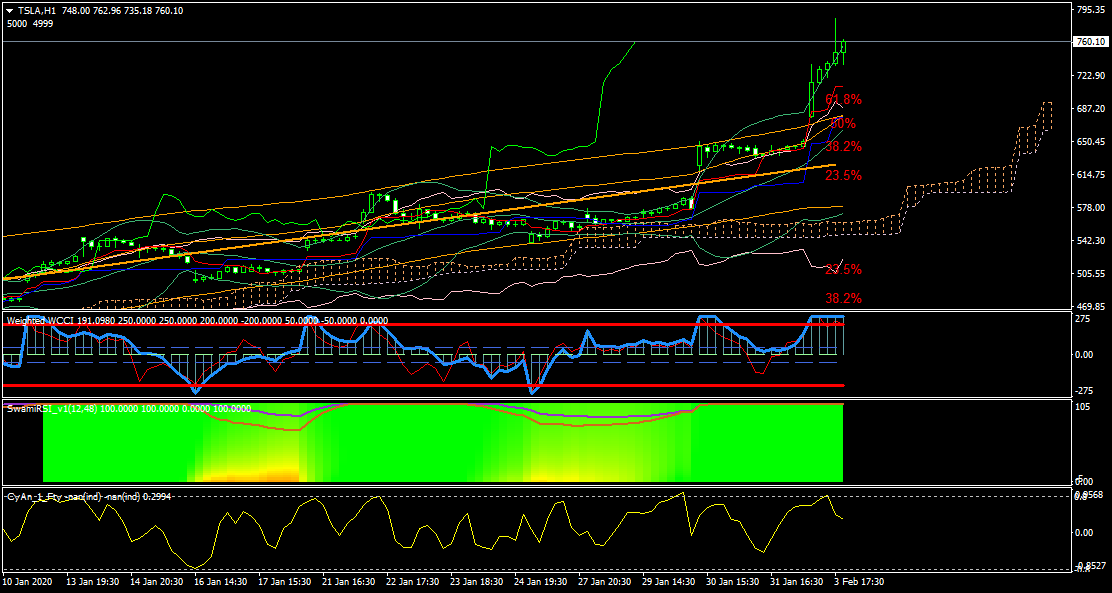
- Weighted WCCI
- SwamiRSI_v1
- ZUP_v66
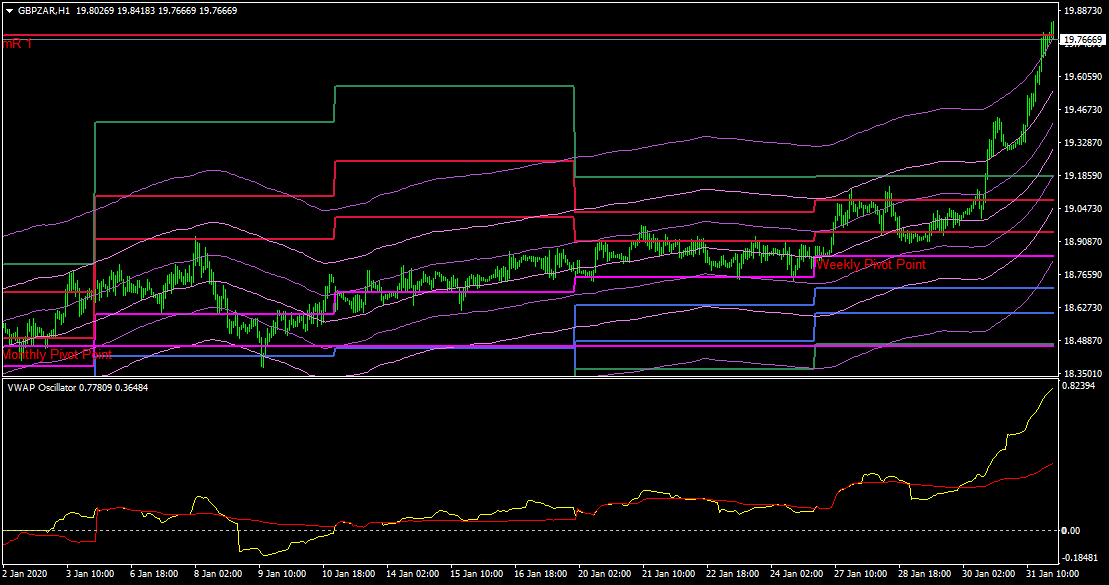
- WeeklyPivot
- MonthlyPivot
- CoronaTrendVigor_v2.1
- CyAn_1_Fty (lenth=3)
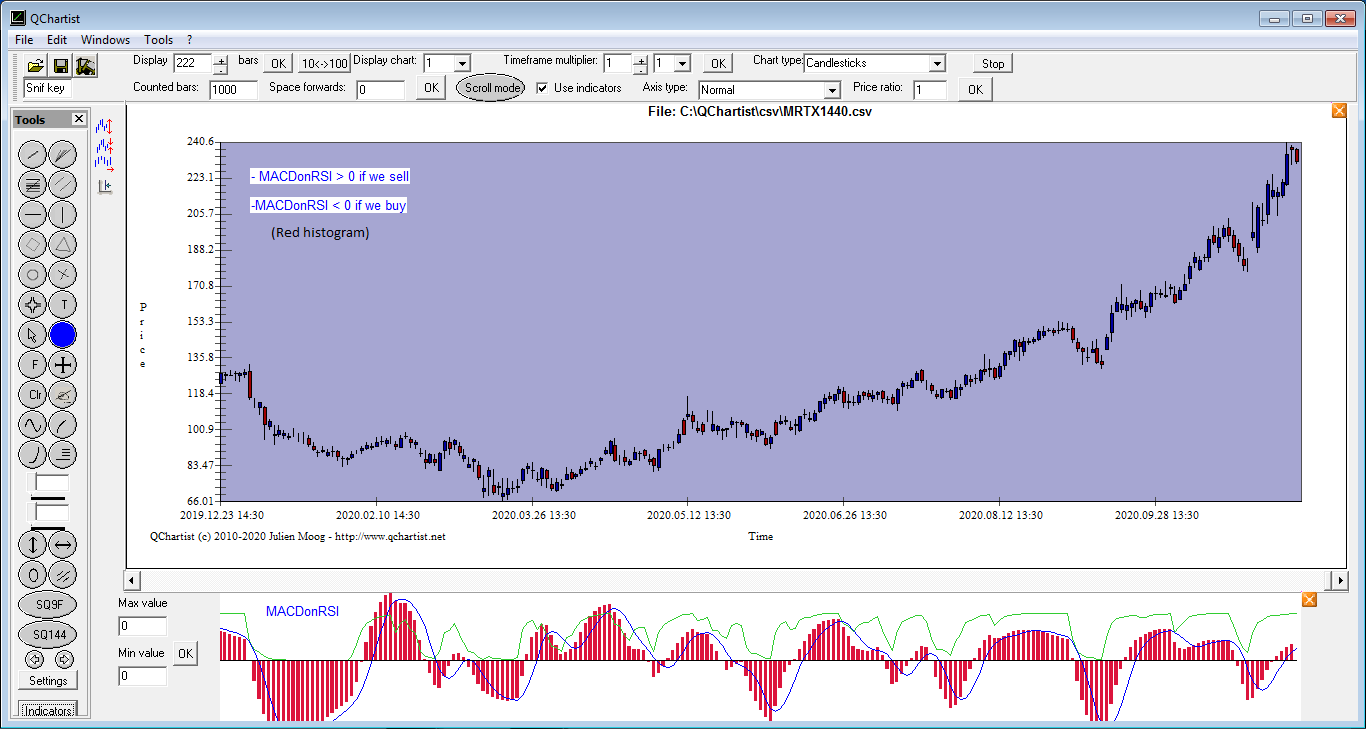
- MACDonRSI
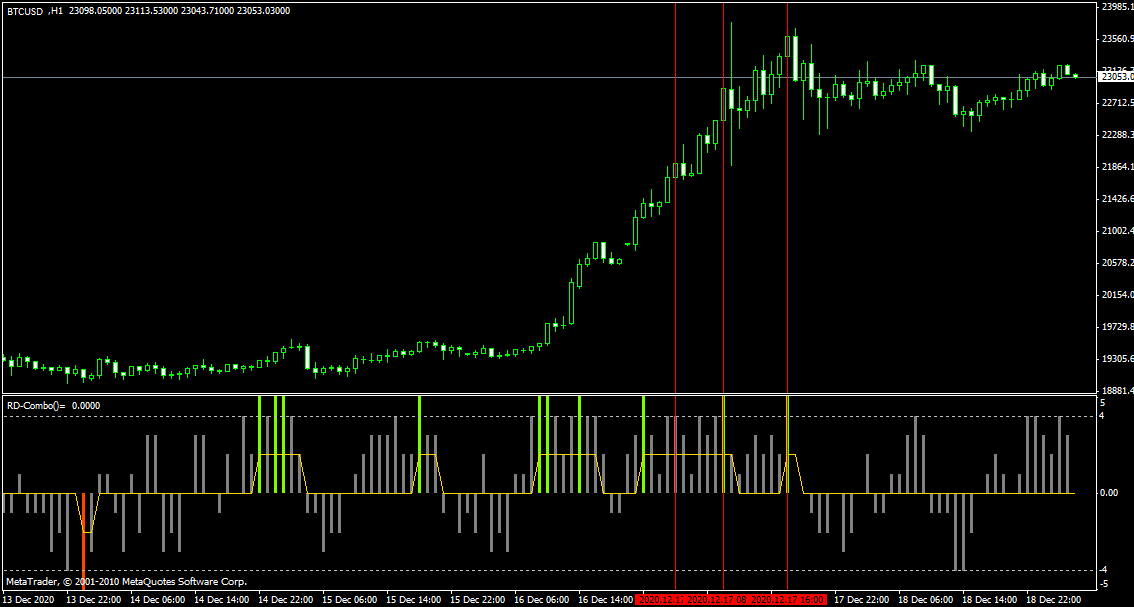
- RD-Combo
- Directional Volume Index (50,50,5)
List of MT4 templates needed:
- !BABON1H
- !PRD_WWCCI
- !system_sync
- !Corona
- 0tmacg
- JM cog
- !MA C W Pivot
- jm adr murrey
- !Channels
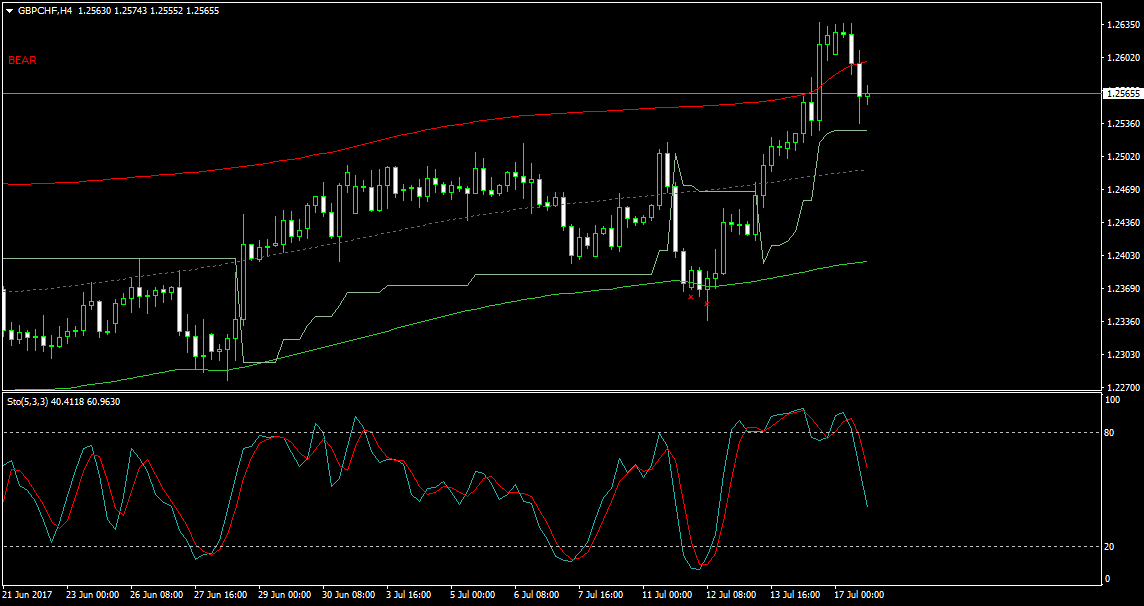
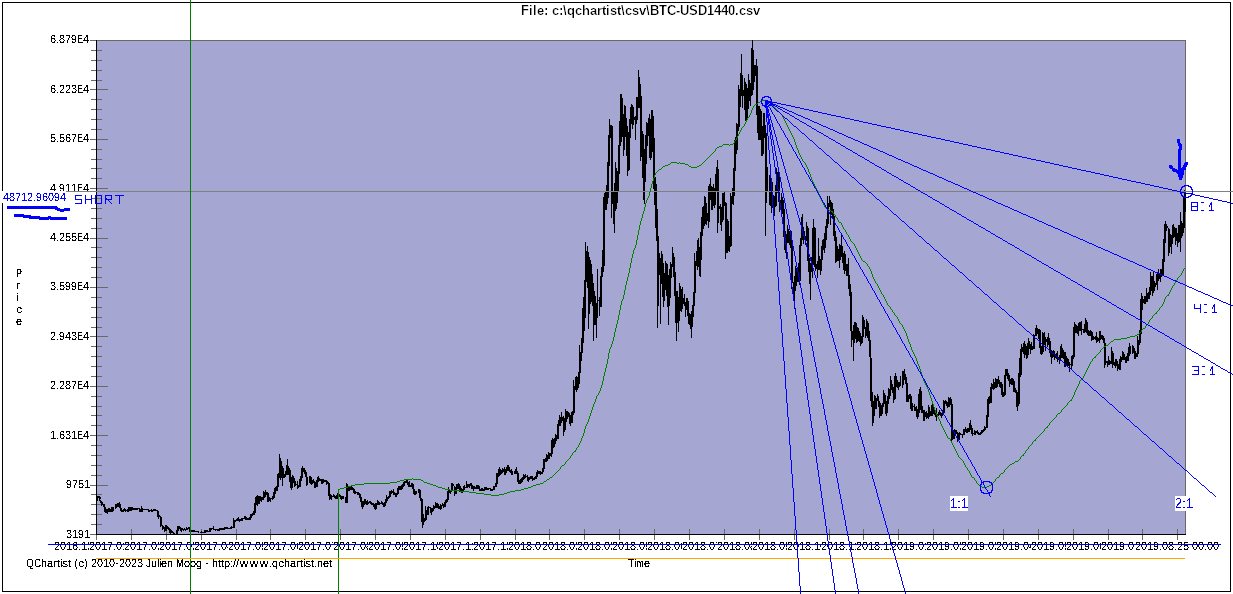
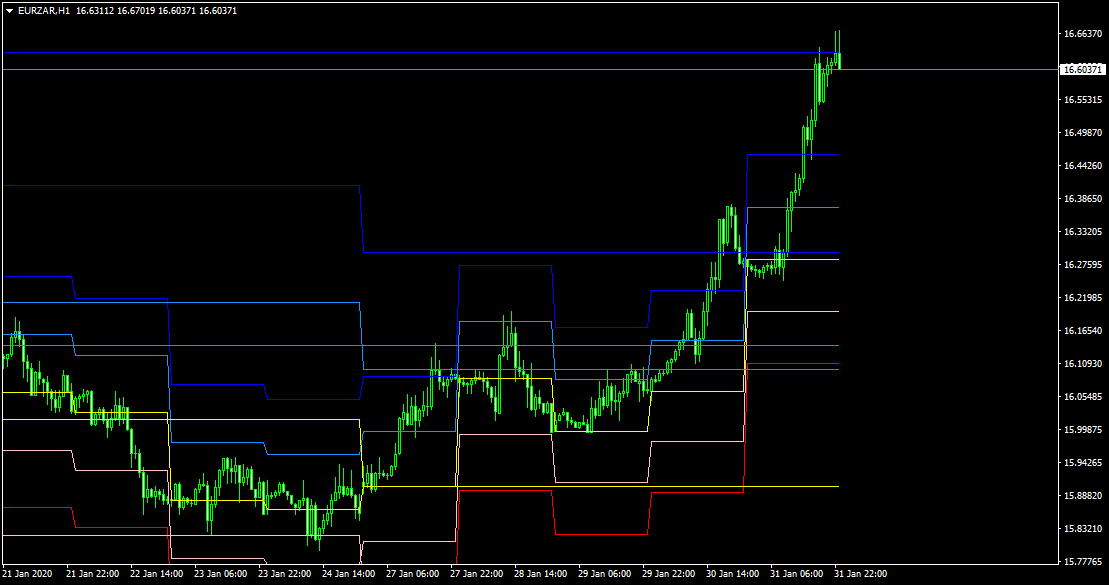
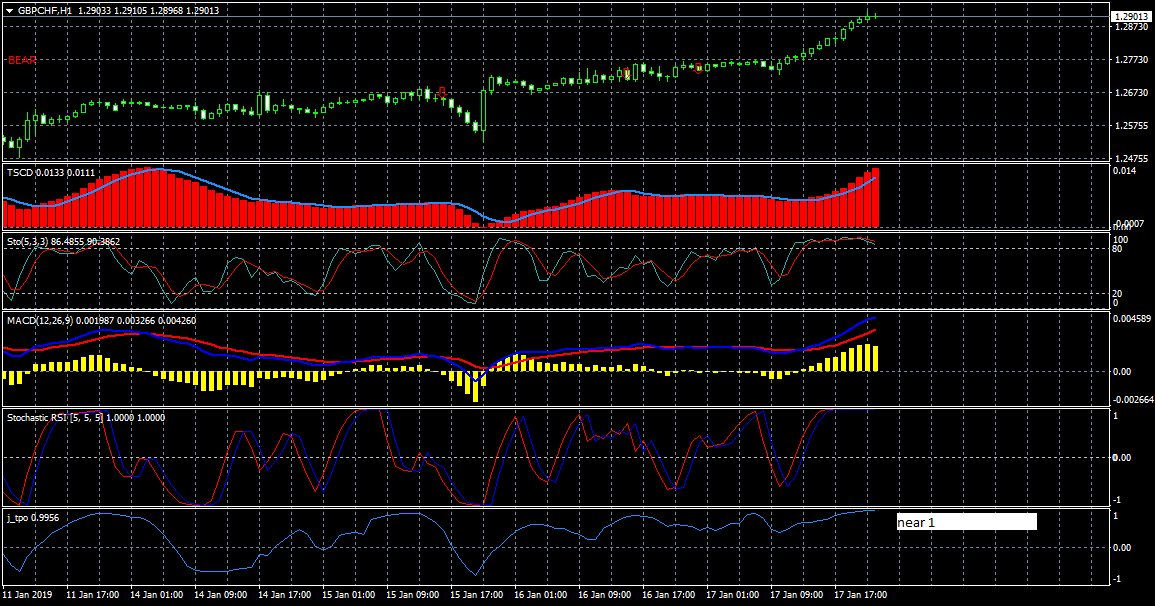
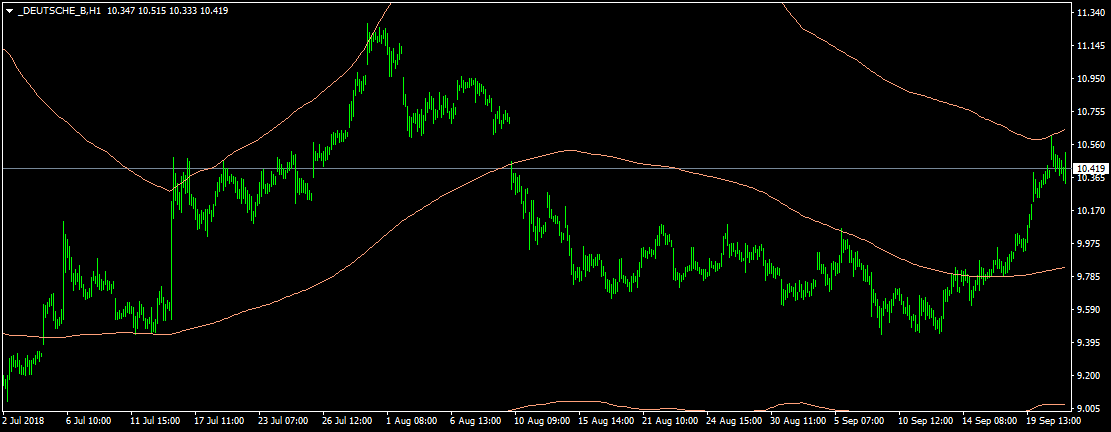
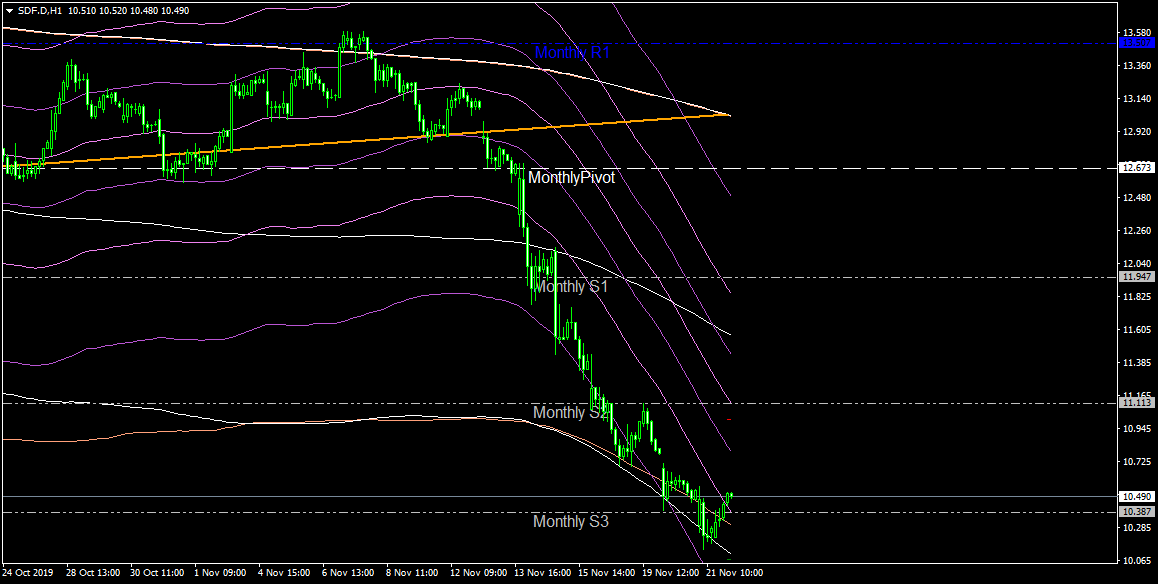
- With template !system_sync: price is on the the Average Daily
Range (ADR 1.1) blue marine line imperatively
- With template !system_sync: price is on the the Average Monthly
Range (ADR 1.13) blue marine line or MonthlyPivot R1-3 or S1-3 (TPL !MA C W Pivot)
- With template !system_sync: price is above the Average Weekly Range
(ADR 1.12) yellow line
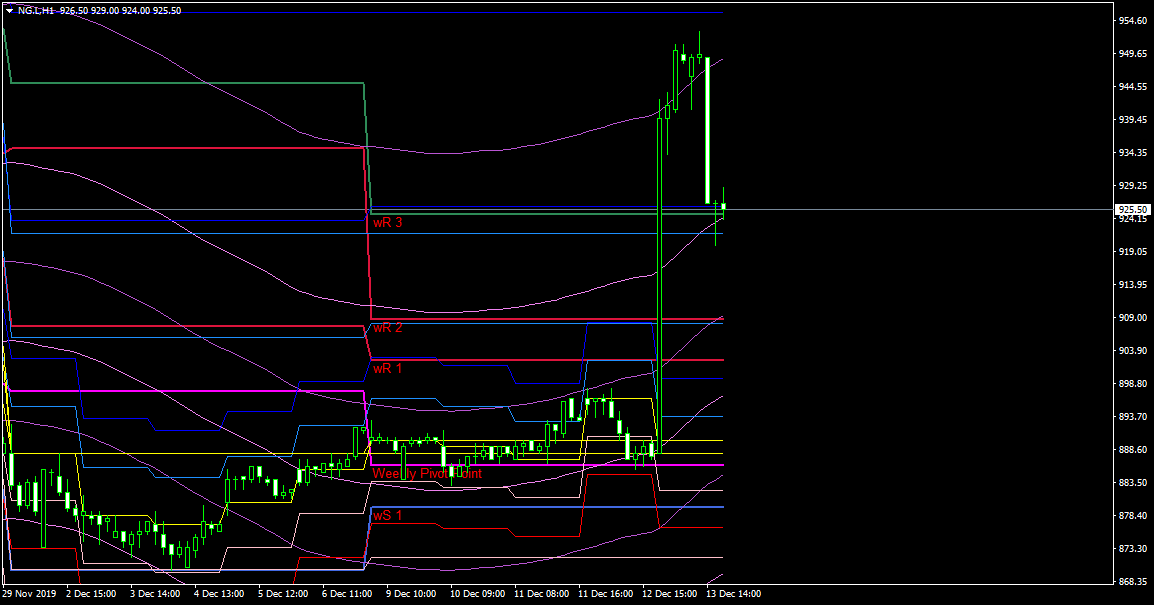
Interesting:
- With template !PRD_WWCCI: price is near past regression deviated
(orange) higher band, fibo (orange) higher band and atr channel (pink)
higher band
- With template !PRD_WWCCI: Weighted WCCI blue thick line is on
the higher red line
- Ichimoku cloud trend up if we sell, trend down if we buy
- Bollinger Bands on upper or lower band
- With template !PRD_WWCCI: SwamiRSI_v1 is stuck on the upside or downside imperatively
- With template !PRD_WWCCI: CyAn_1_Fty is near 0.8 or -0.8
- With template jm adr murrey: price is >= the orange +1/8 Ove
orange
line of Murrey Math on H1, H4, Daily, Weekly or Monthly timeframe
- With template !Corona:
- With template !Corona: TSCD
red histogram > < 0
- With template !Corona: Stochastic 5,3,3 near 80
- With template !Corona: RealMACD blue line is at least as high as the
yellow histogram
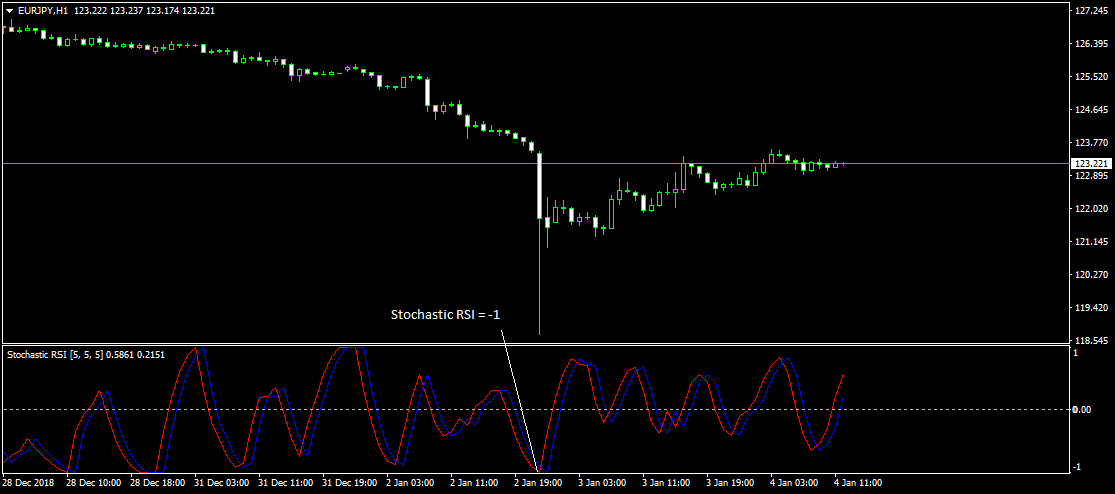
- StochasticRSI is at -1 or 1
- j_tpo > < 0
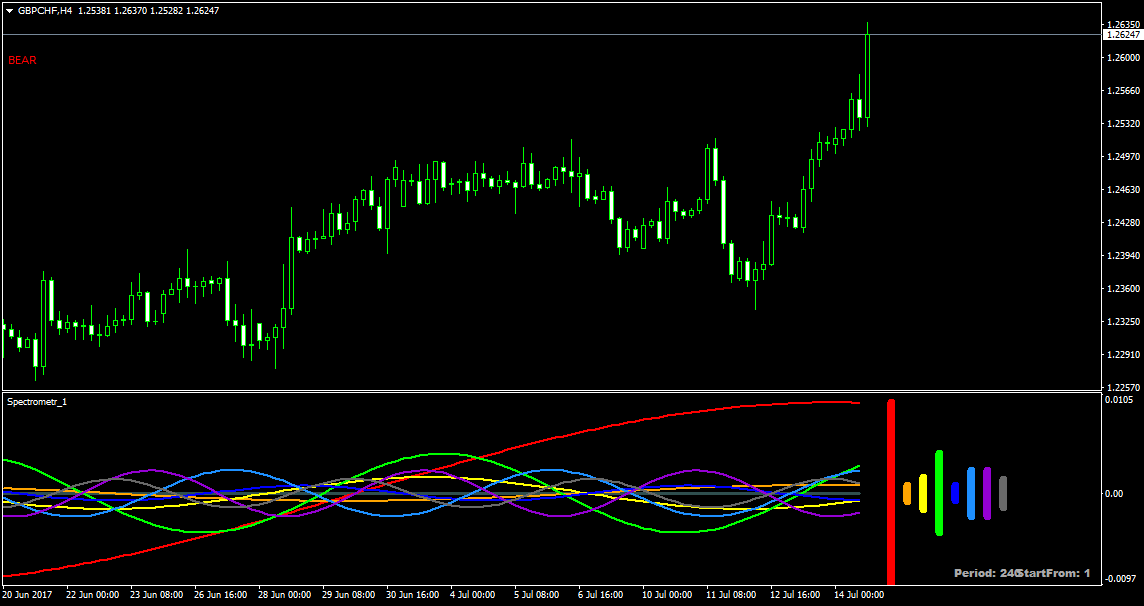
- One of the 2 sinusoids with the highest amplitude is pointing down (QChartist fftspectro indicator) (1 hour to monthly TF)
- The sinusoid with the highest amplitude is pointing down (red) (MT4 spectrometer_separate indicator)
- If sinusoid with the highest amplitude is not pointing down (MT4 spectrometer_separate indicator) but the 2nd sinusoid with the highest amplitude is pointing down, fftspectro sinusoid with the highest amplitude must point down.
- Optional but advised:
- You should use the Center Of Gravity on TF Daily or Weekly or Monthly to see if the direction of the trend is OK. (not required)
Don't trade against the trend.
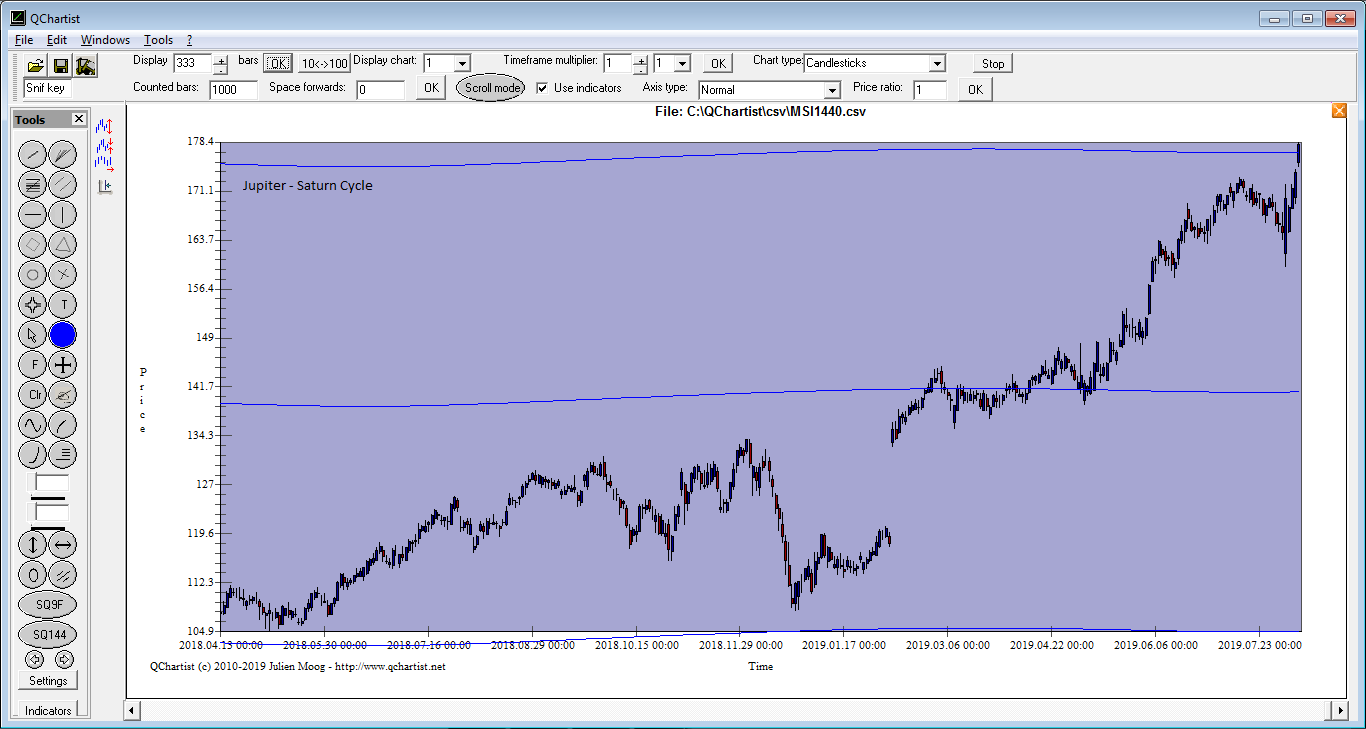
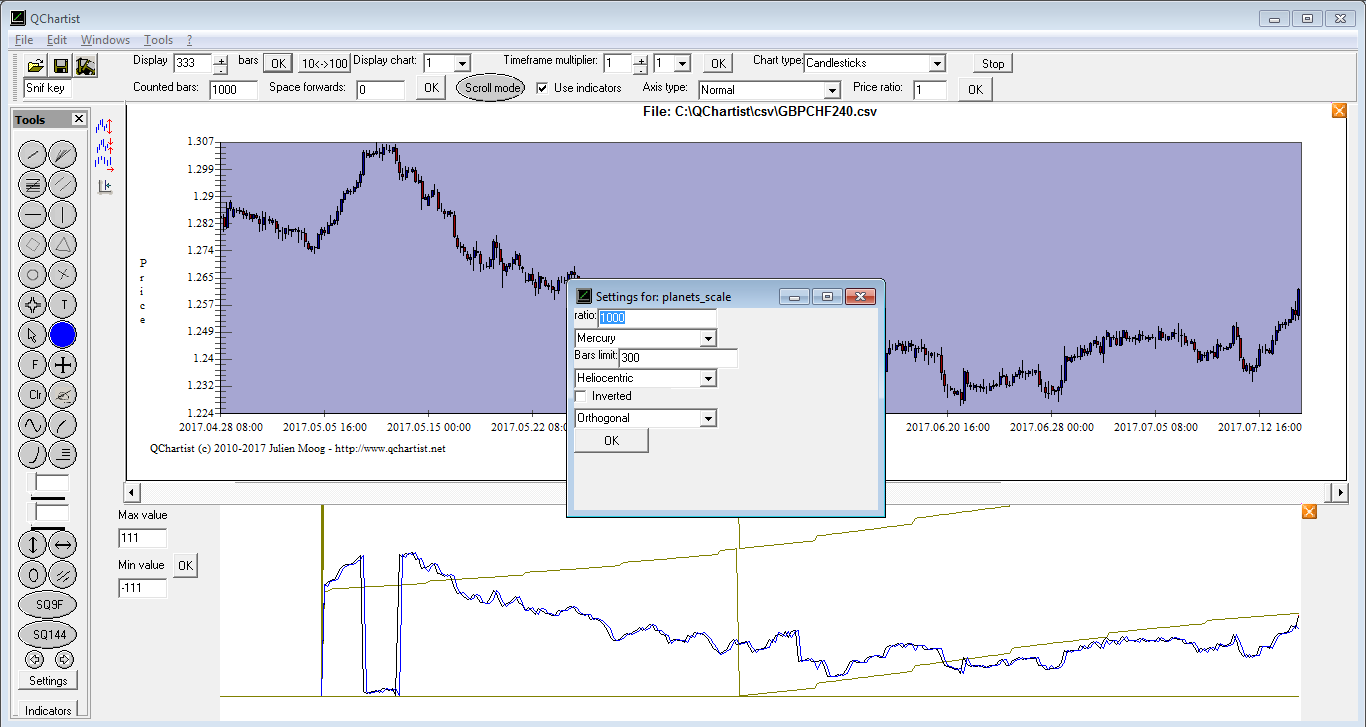
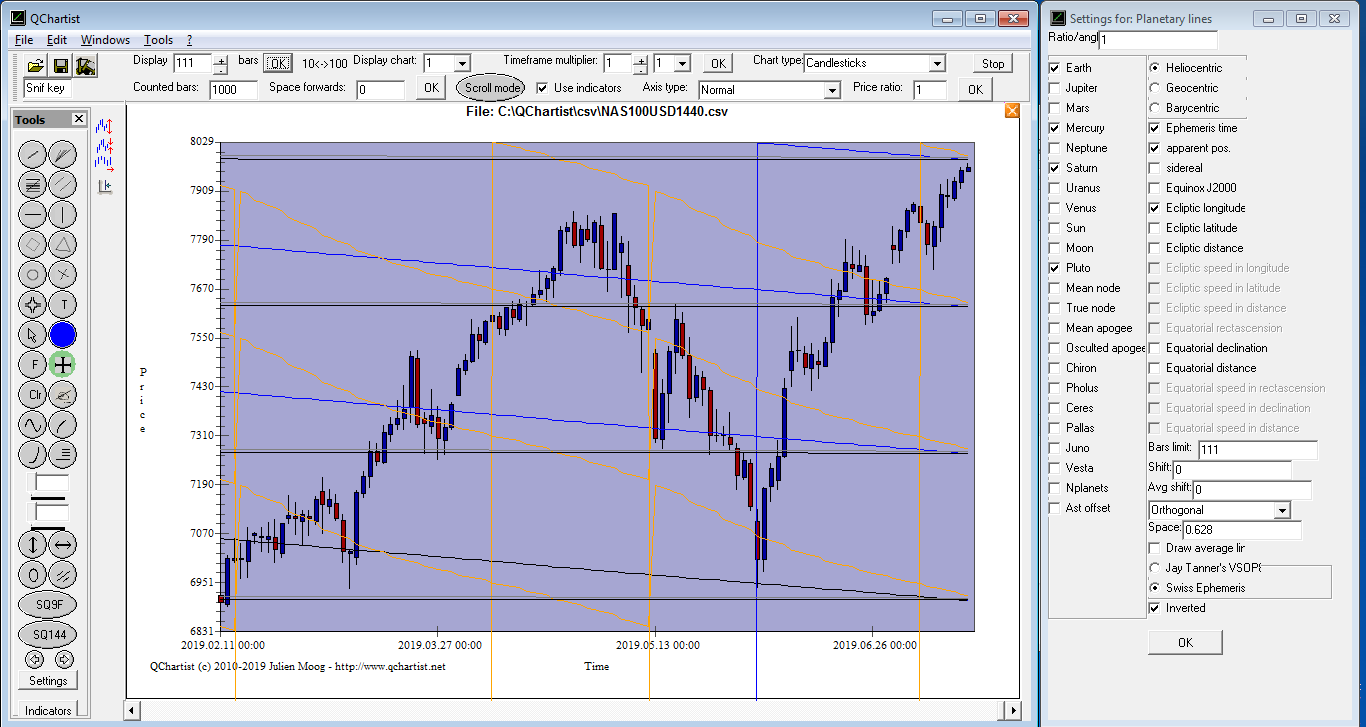
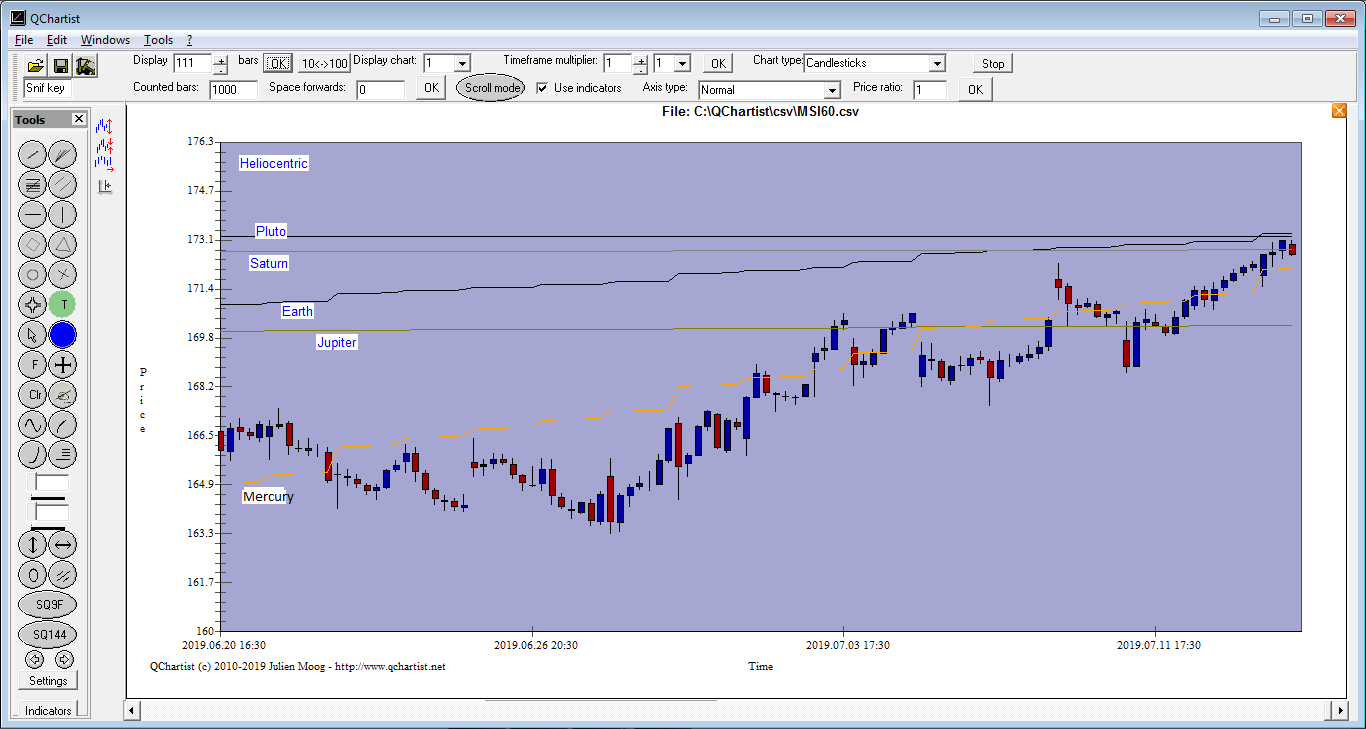
- With the QChartist software: detrended price is near a line of the
Mercury or Venus or Earth indicator (resistance) (planet scale indicator)
If it is not the case, PlanetSqn on Daily TF or Jupiter - Saturn Cycle on Daily TF or Moon Scale on H1 can do the job.
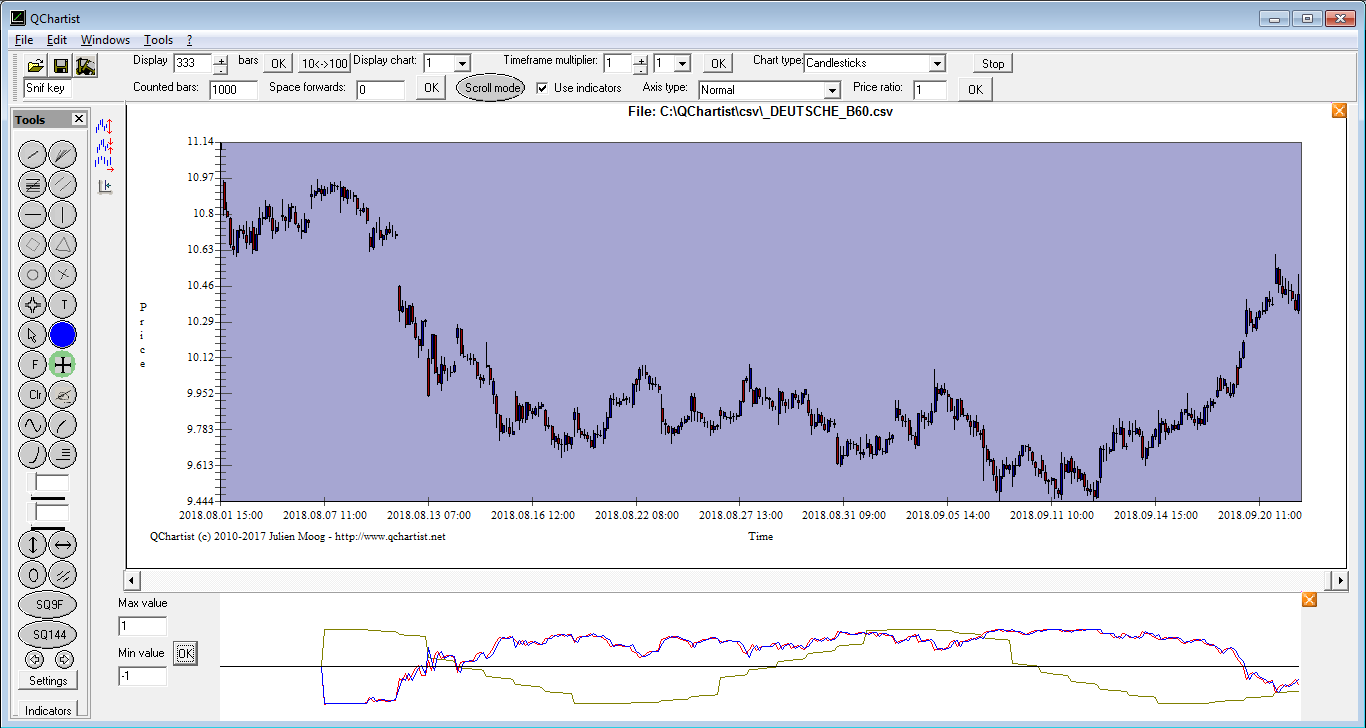
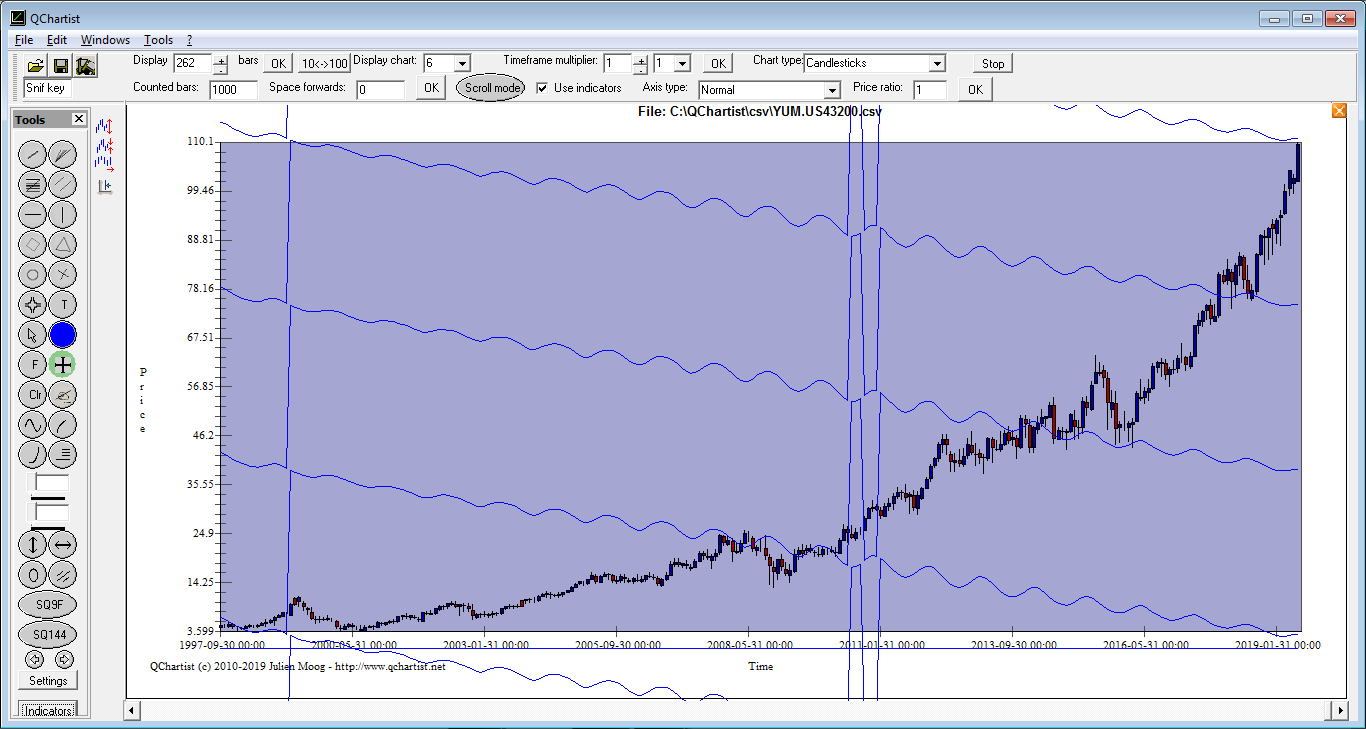
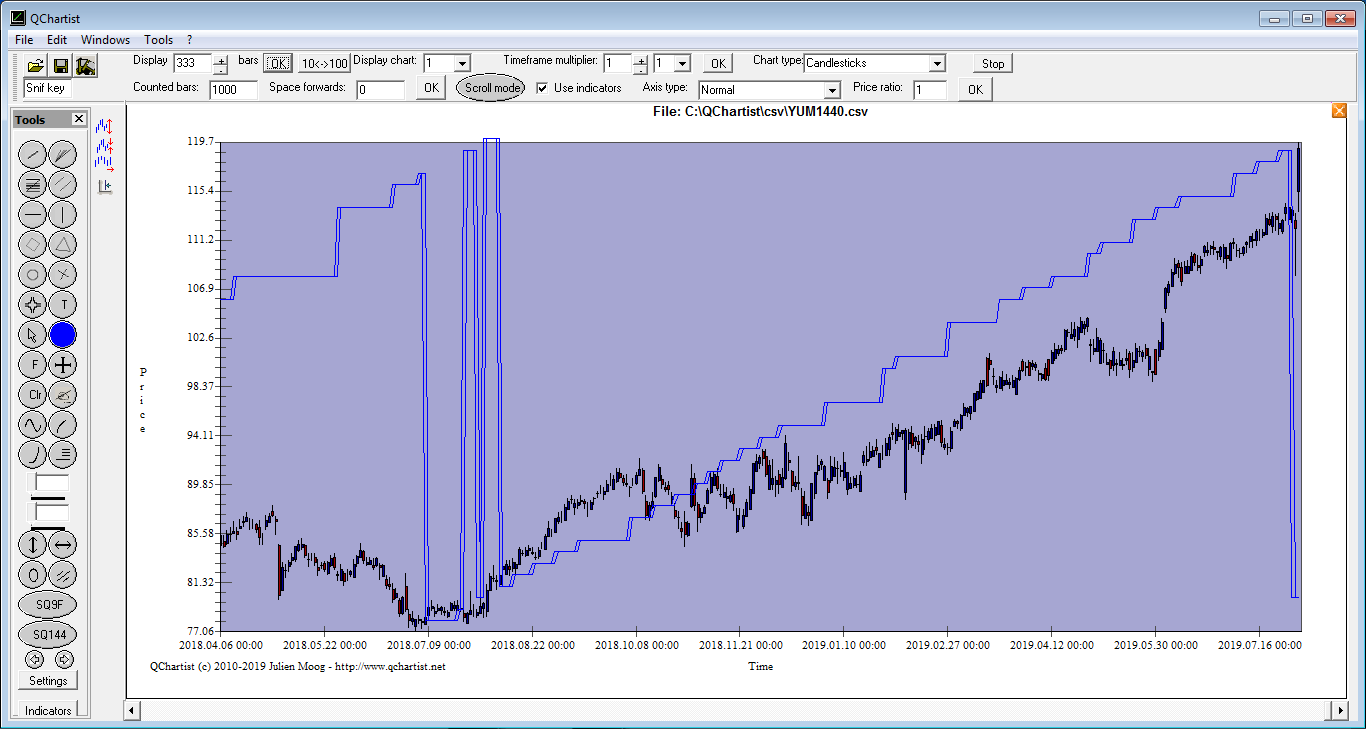
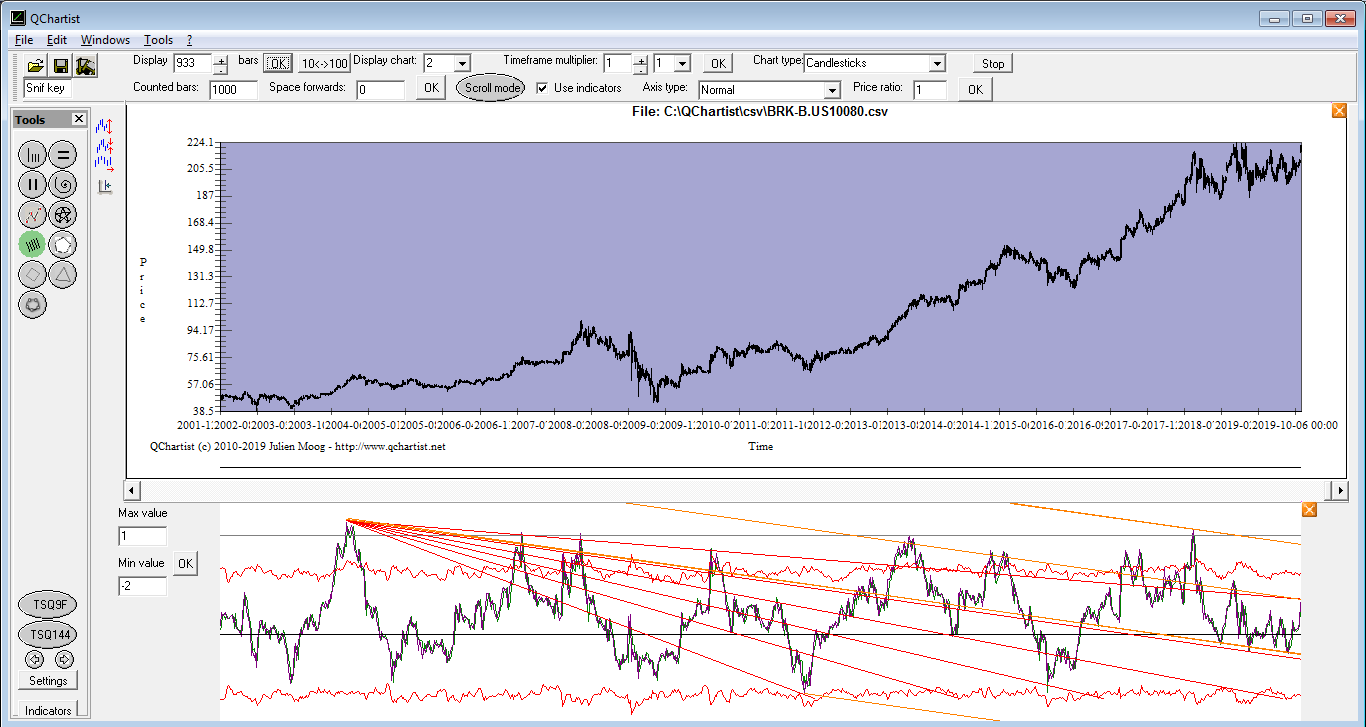
In order to open the .csv MT4 charts from QChartist, you need to export
.csv files from MT4 history center.
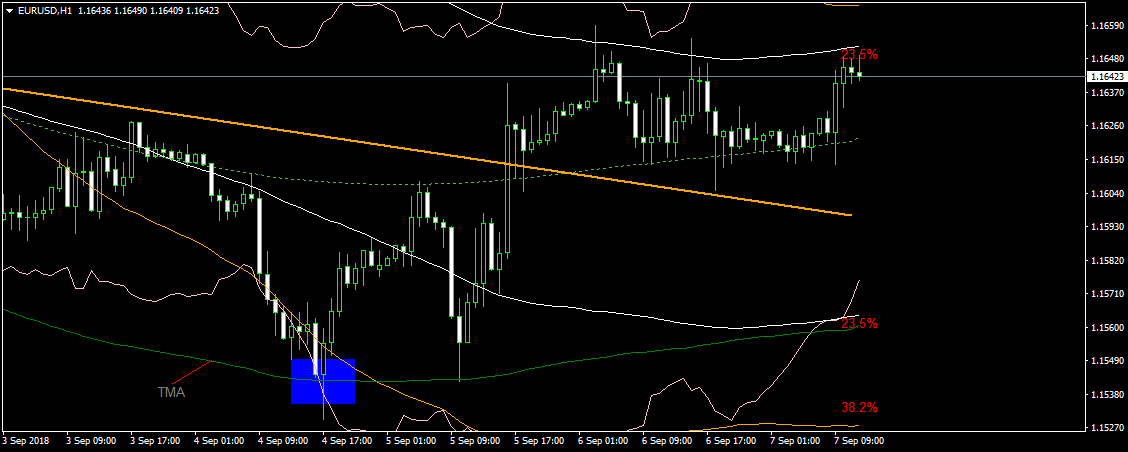
- You can also use the TMA indicator to detect tops and bottoms with a timeframe of 240 set in the indicator settings (not required)
Example:
- The blue bottom enveloppe is below the marron bottom enveloppe
- The CoronaTrendVigor_v2.1 indicator is flat
- With TPL !MA C W Pivot We are near the Weekly Resistance 3 for the current week or for the previous week
- With TPL !MA C W Pivot We are on the MonthlyPivot R1-3 or S1-3 for the current month or on the Average Monthly
Range (ADR 1.13 TPL !system_sync) blue marine line
- Price must be > MonthlyPivot violet line if we sell or price < MonthlyPivot violet line if we buy
- With TPL !MA C W Pivot We are on the last line of MA Chanels FiboEnv Mid imperatively
- With TPL !MA C W Pivot With VWAP Oscillator: the 2 lines are > 0 if we sell or < 0 if we buy
- You can also use BB - HL and Moon Scale to detect tops and bottoms
Example: - With TPL !Channels: we are near the upper or lower band of BB - HL
If the price still goes into the wrong direction:
- Wait for a green bar of RD-Combo to enter one more time (highly recommended)
- Look at the 3 bands on daily or weekly charts ( BB - HL , Vegas , MA Chanels FiboEnv Mid) (Vegas is very useful)
- Look at Jupiter - Saturn Cycle or Planetary Lines Convergence
If the price still goes into the wrong direction:
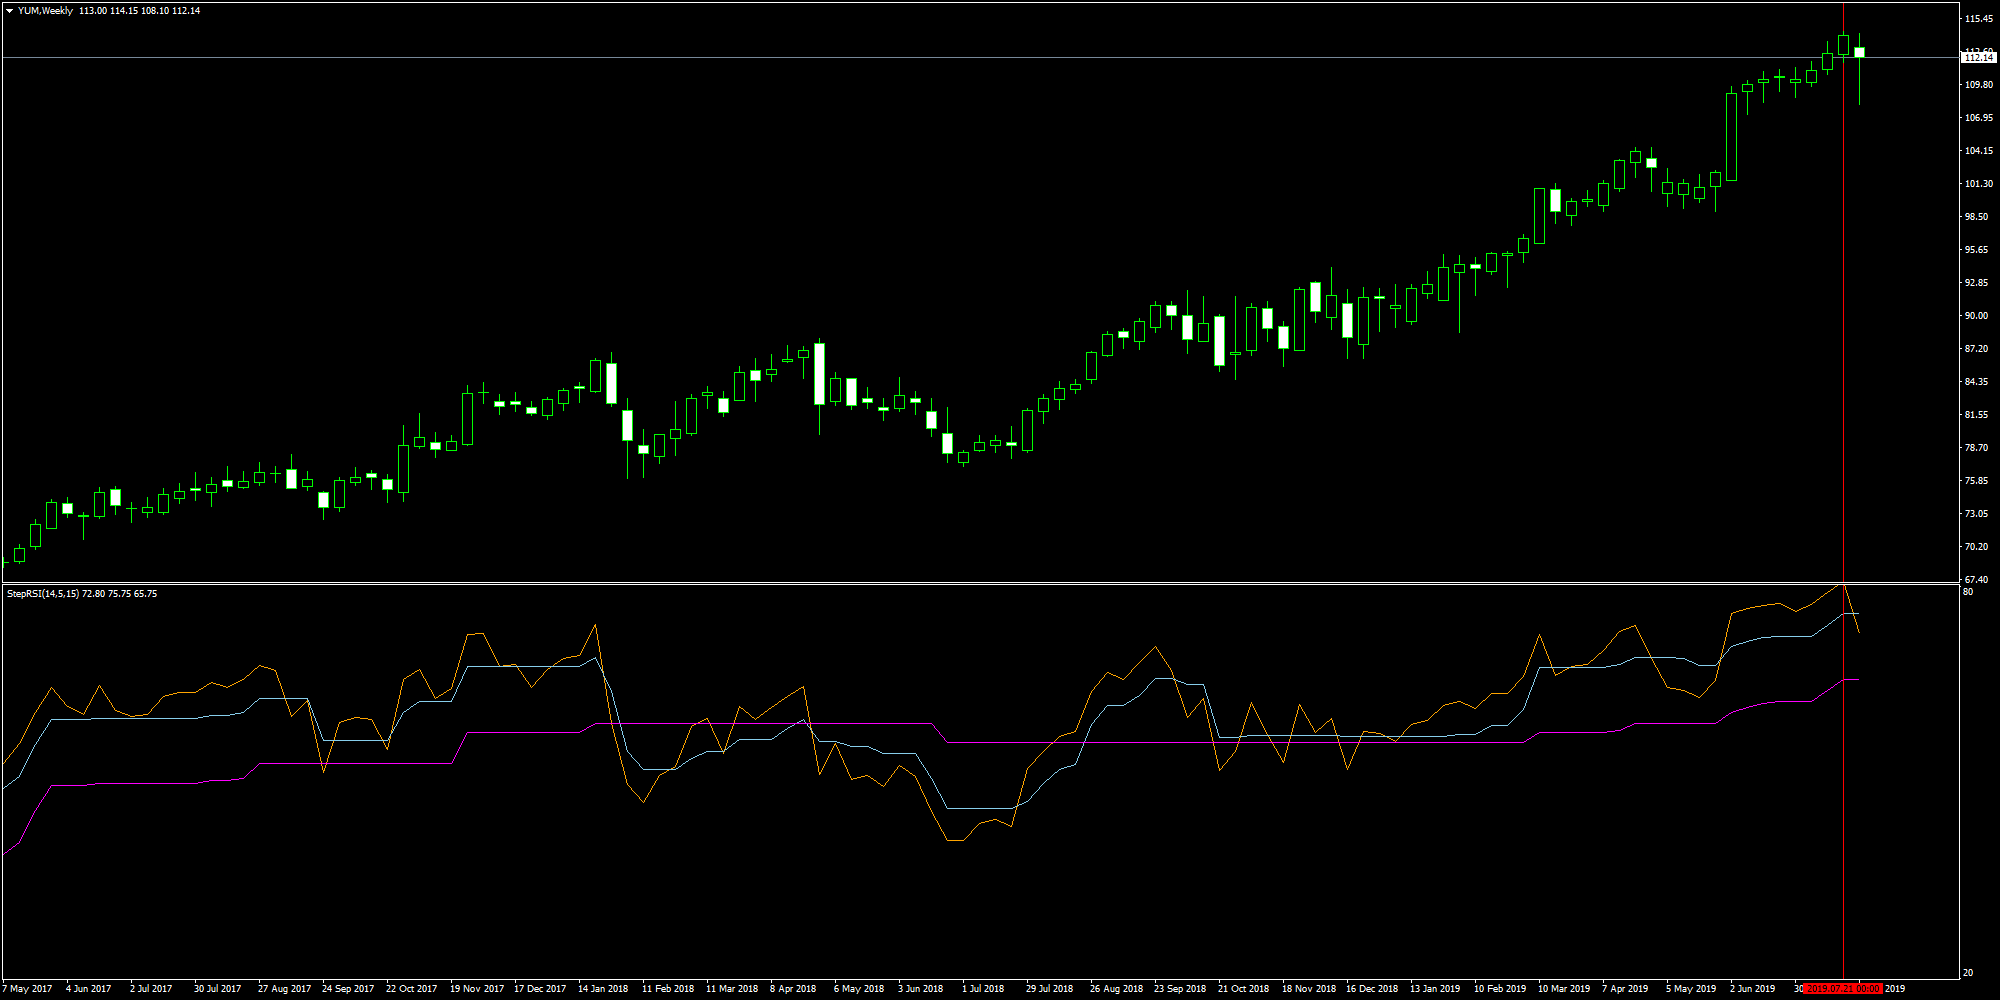
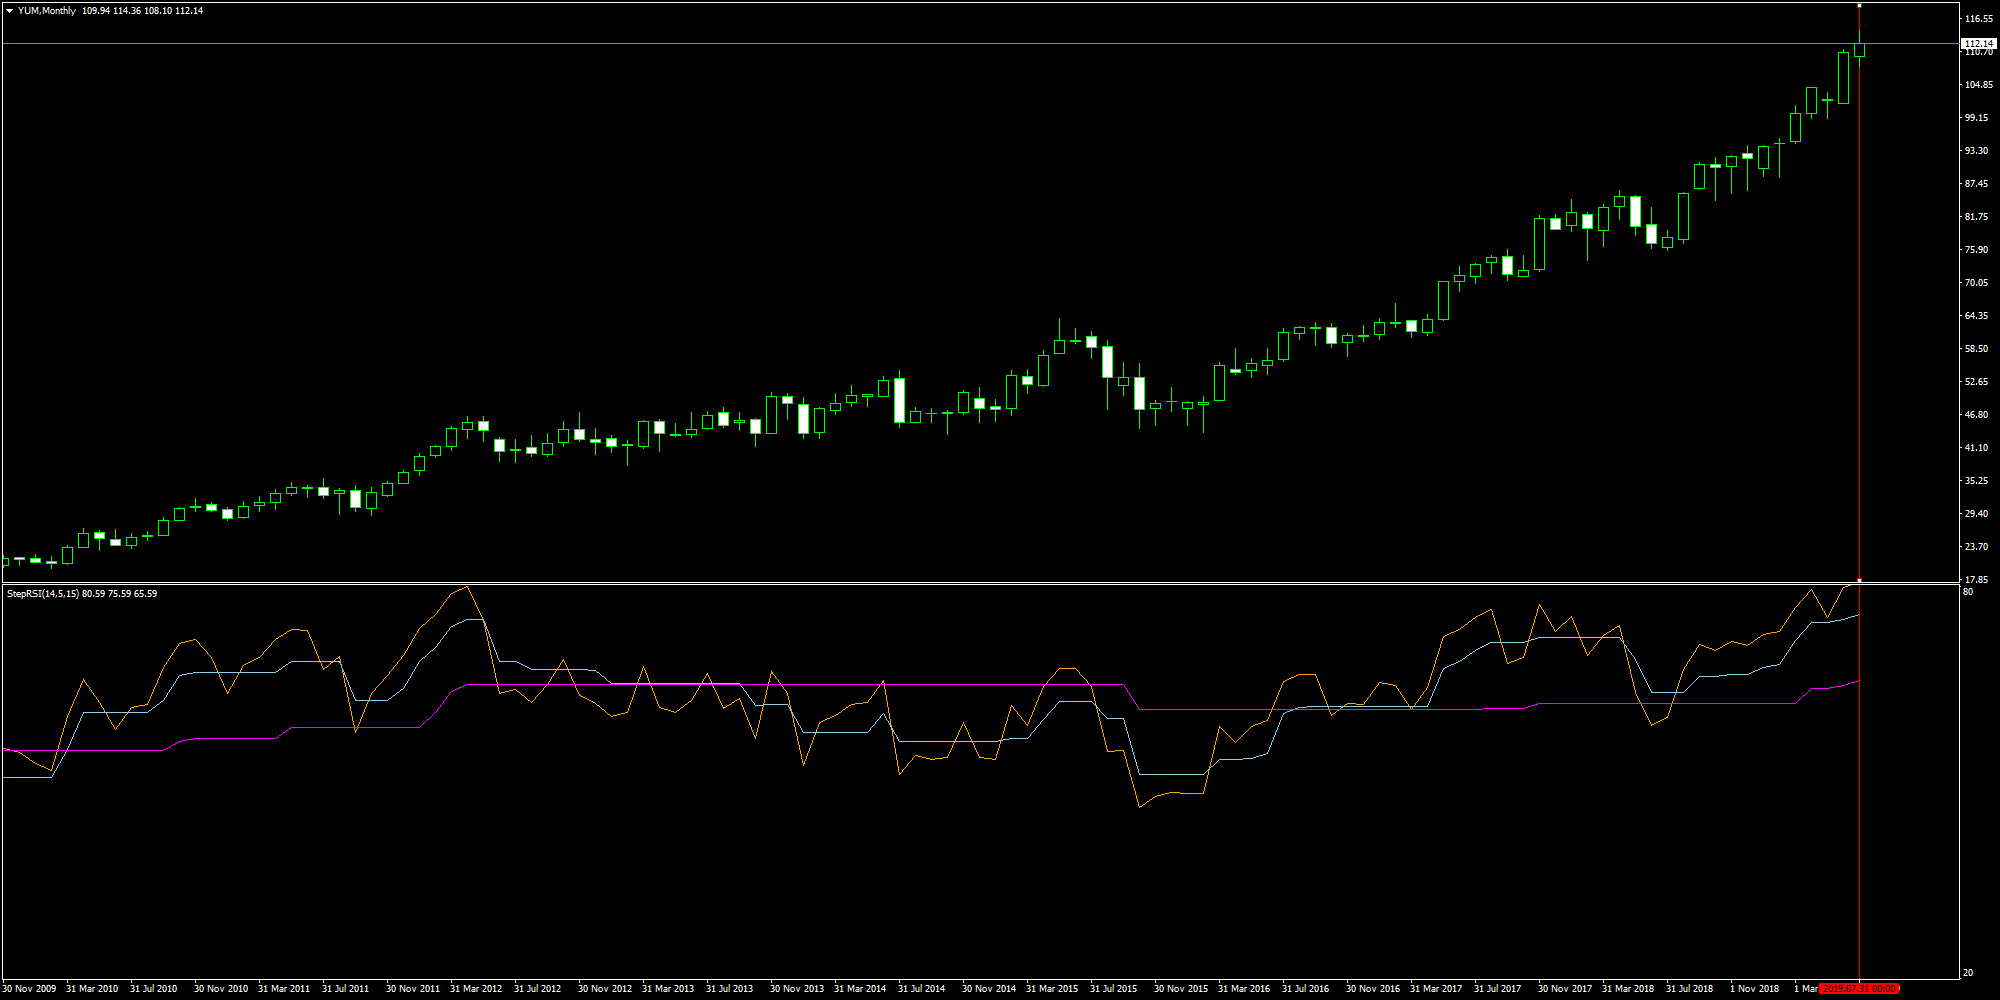
- Look at the previous bar of StepRSI_v2 on the weekly or monthly chart for >80 or <20 (not required)
If the price still goes into the wrong direction:
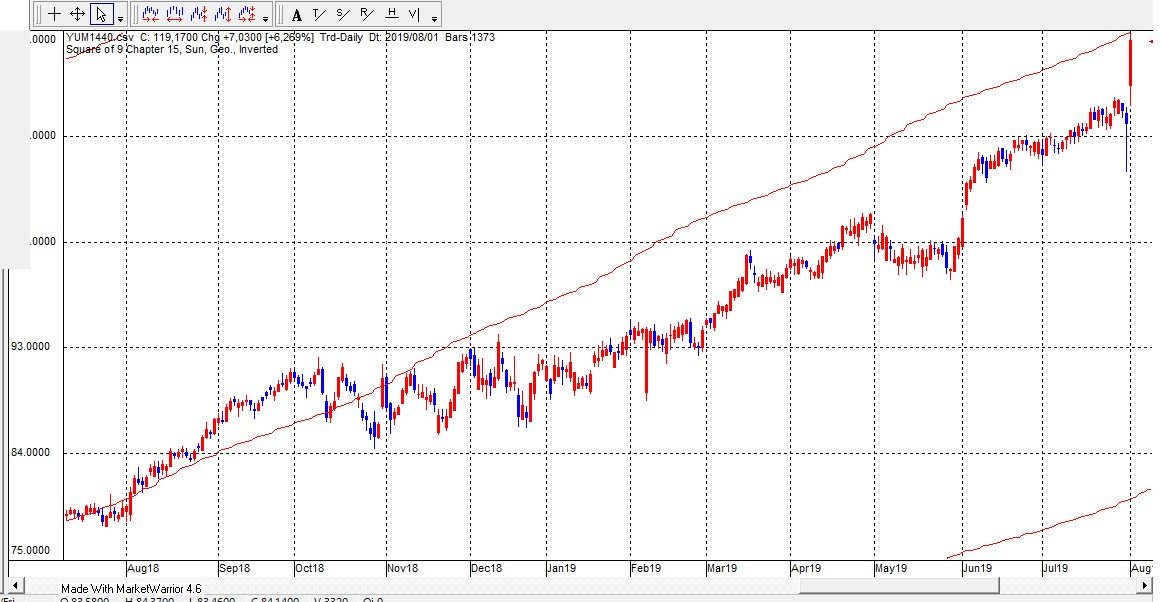
- Look at the Planetsqn indicator (Sq9Chapter15) (required if all other astro indicators are not ok) on the daily tf with Market Warrior or QChartist
- You can look at Past Regression Deviated Log (not required) with MA Chanels FiboEnv Mid
- You can look at Past Regression Deviated Log with MA Chanels FiboEnv Mid and BB - HL period 500 (Past Regression Deviated Log not required, BB - HL period 500 not required, but BB - HL period 200 and MA Chanels FiboEnv Mid highest or lowest band required)
(TPL !Channels)
- You can look at Monthly Pivots Points with indicator bowels (required if RD-Combo is not enough)
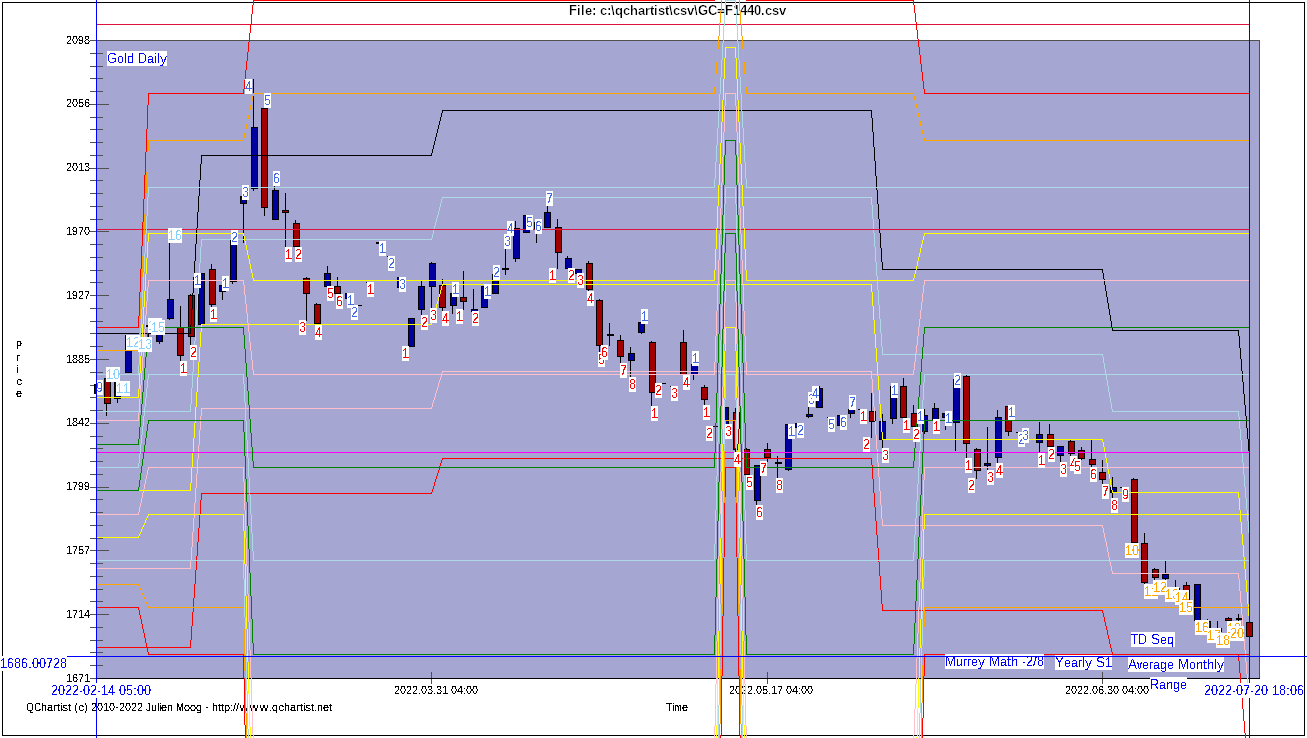
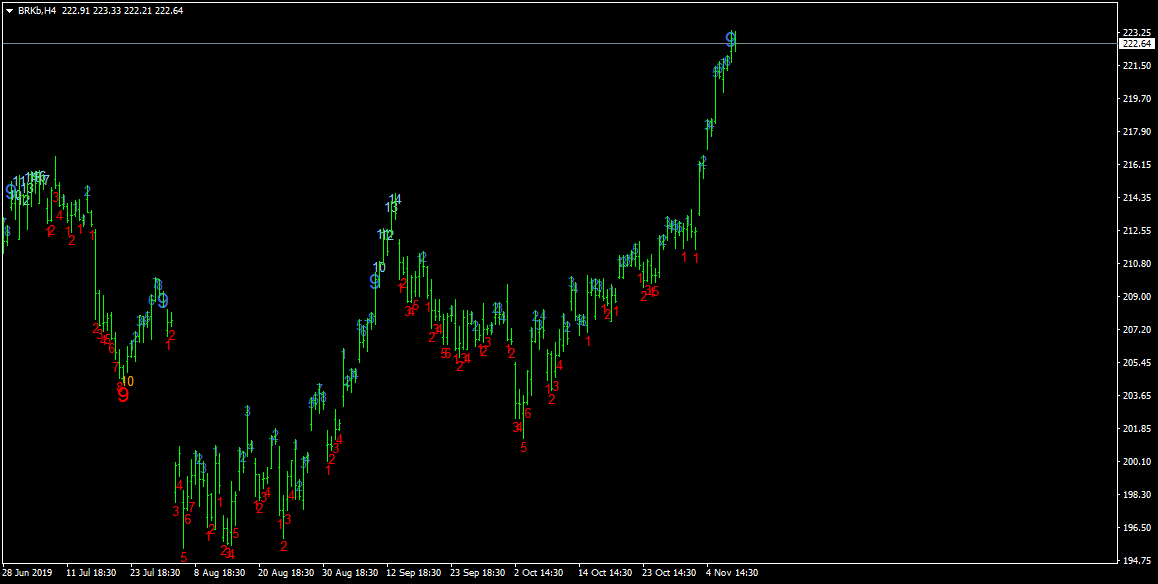
- You can look at TD Sequential if there is a 9 or a 13 (not required)
- You can look at ValueChartATRChannels with Fibo Fans and Pitchforks (not required)
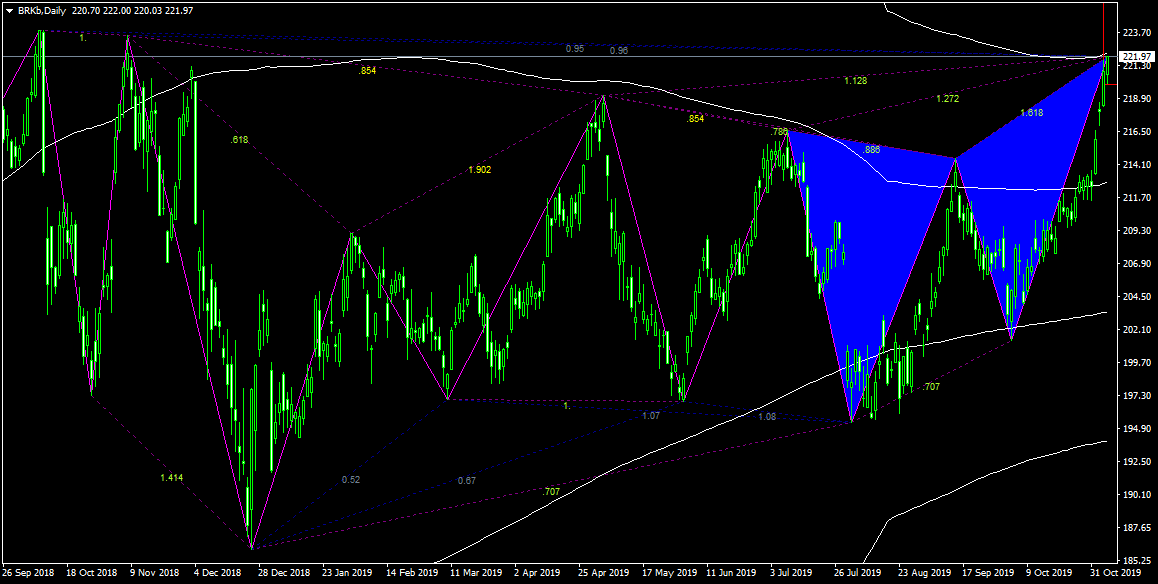
- You can look at ZUP for a butterfly (not required)
- Finally you can use StepRSI 225 and Stepftvcprdl with Fibonacci fans,
Fibonacci retracements, Pitchforks, and Fibonacci arcs on 1 hour to daily charts like that: (not required)
- tradingview.com has the best historical data. It's recommended to use it for long term view of the market. Here it is on Monthly charts: (not required)
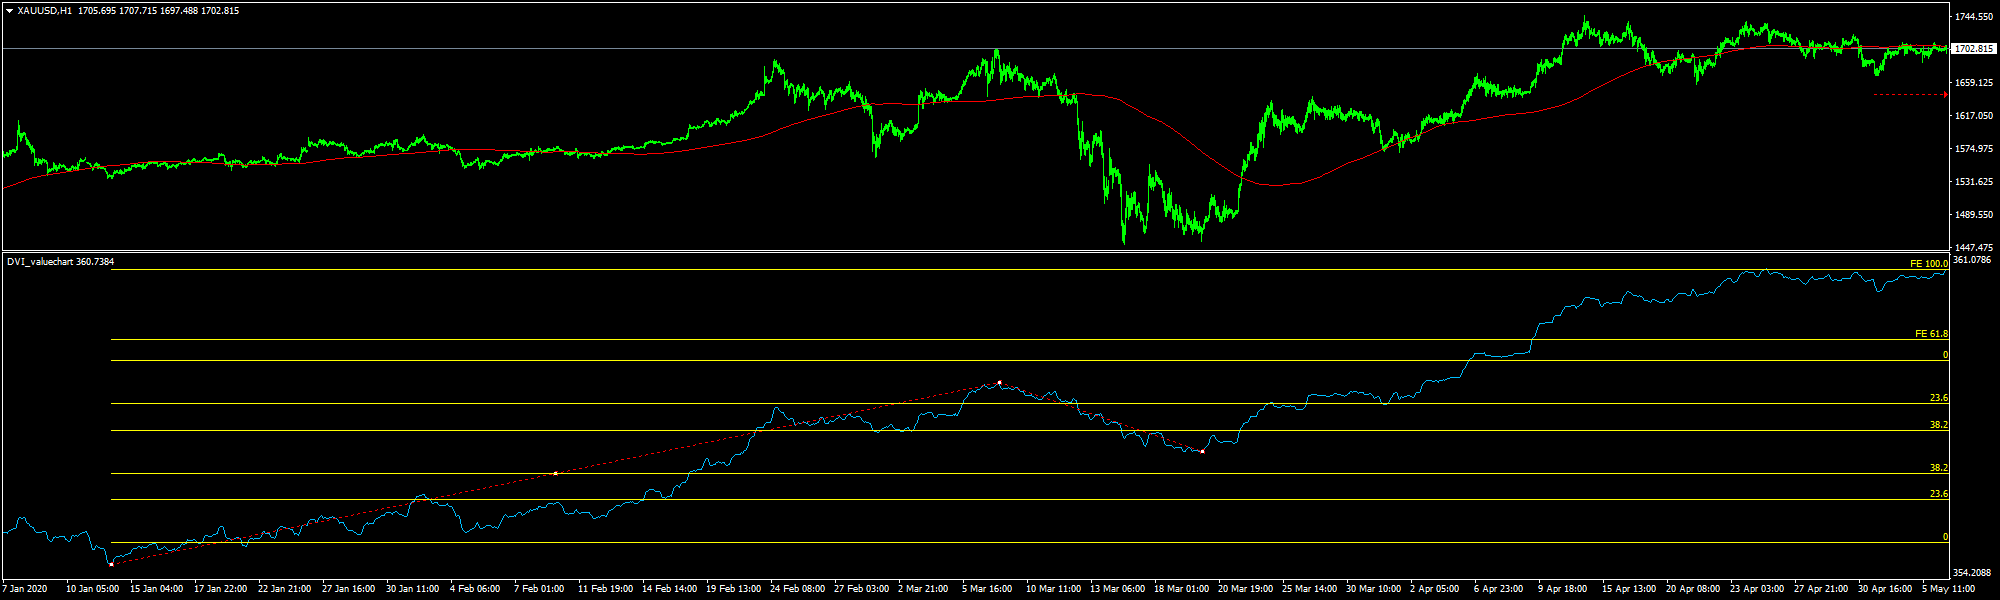
- DVI_VALUECHART with Fibo expansions (not required)
- With the Directional Volume Index indicator :
gold line must be > 0 and distant from 0 if we sell or
gold line must be < 0 and distant from 0 if we buy
Exit (Target Point) (please use H1 timeframe instead of H4):
With template 0tmacg:
- price reachs the Volatility.Pivot gray line
or
- stochastic 5,3,3 is near 20
or
- price reachs the Tma+CG middle dot line
Do not hesitate to use the PeriodConverter in MT4 Scripts if your TP becomes negative.
System #2 August 2022: System Sequential
This system is still under test phase but will give you more opportunities. It is much more simple. Use it at your own risk.
- TD Sequential is >=13 on Daily timeframe
- Optional: Price is near BB - HL Lower / Higher band on Daily timeframe
- Murrey Math on Daily timeframe is at least on the orange line + - 1/8
- Yearly Pivot Points indicator (MonthlyPivotcpp) max or min
- Average Monthly Range indicator (ADR Monthly) max or min
- Astro on Daily timeframe:
- Price bounce on Jupiter - Saturn Cycle
or
- Price bounce on PlanetSQN Chap 15
or
- Price bounce on Planet_Scale
- On Monthly timeframe:
- Use price action with Drawing tools (Fibo Fans or Fibo Rets or Ellipse or Pitchforks or Grids or Speed Resistance Lines or Gann Fan or Schiff Pitchfork)
and
- Use price action with Drawing tools that require the "Lock Price Time Scale relationship" (Modify Axis Type to Fixed and set the Lock Price Scale Ratio value according to the number of Displayed Bars. Then you can use Square or Triangle or Circle or Pentagram or Square from Center or Triangle from Center or Fibo Arcs (modify settings) or Seed of Life or Fibo Circles or Speed Resistance Arcs)
Exit (Target Point) (Hourly timeframe):
- price reachs the Volatility.Pivot gray line
or
- stochastic 5,3,3 is near 20 or 80
or
- price reachs the Tma+CG middle dot line
Here are the following objects that you can use:
(the more object you can draw efficiently, the more reliable will be your signals)
Works well on Forex, Indices, Crypto and Commodities.
We use Daily or Weekly charts with maximum number of bars (about 1000 bars).
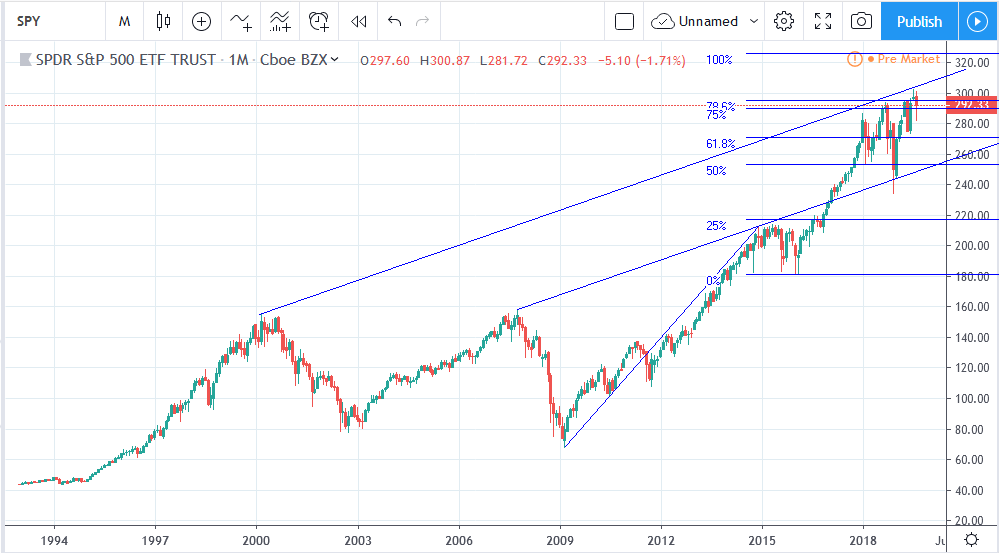
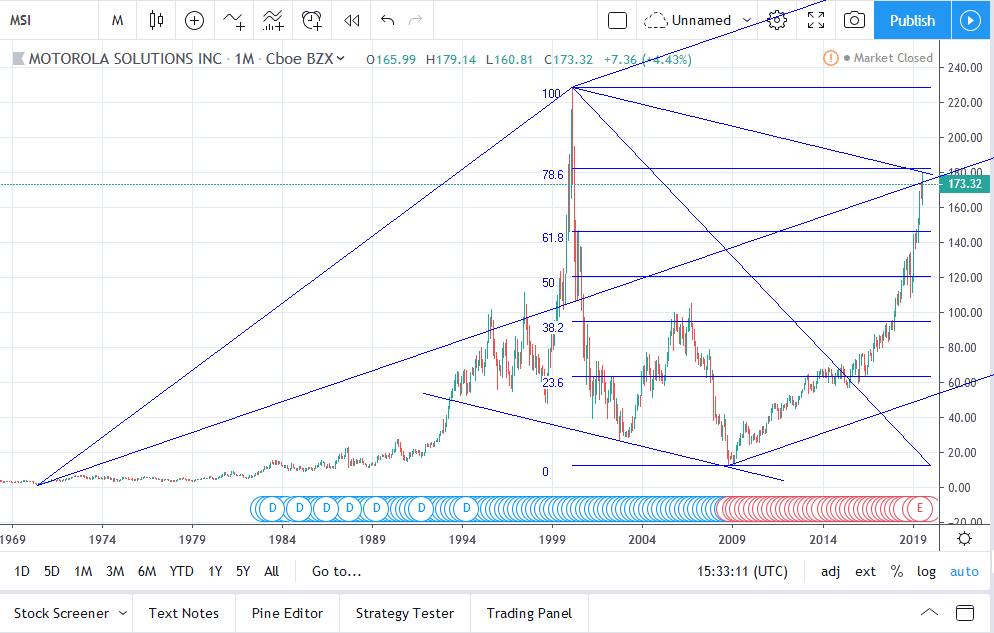
We use scale independant drawing tools, here is the list:
- Trendlines
- Fibonacci Retracements (between 61.8 and 78.6)
- Parallel lines (use it imperatively)
- Ellipse (between 61.8 and 78.6)
- Andrew's Pitchforks
- Schiff Pitchforks or modified or inside in Settings
- Fibonacci Fans (with price mirror setting) (between 61.8 and 78.6)
- Speed Resistance Lines (with price mirror setting)
- Gann Fans (with price mirror setting)
- Gann Grids
- Oriented Cycles
- Triangle from 3 points (between 61.8 and 78.6)
- Fibonacci Rectangle method 1 or 2 in Settings (between 61.8 and 78.6)
- Fibonacci Diamond (between 61.8 and 78.6)
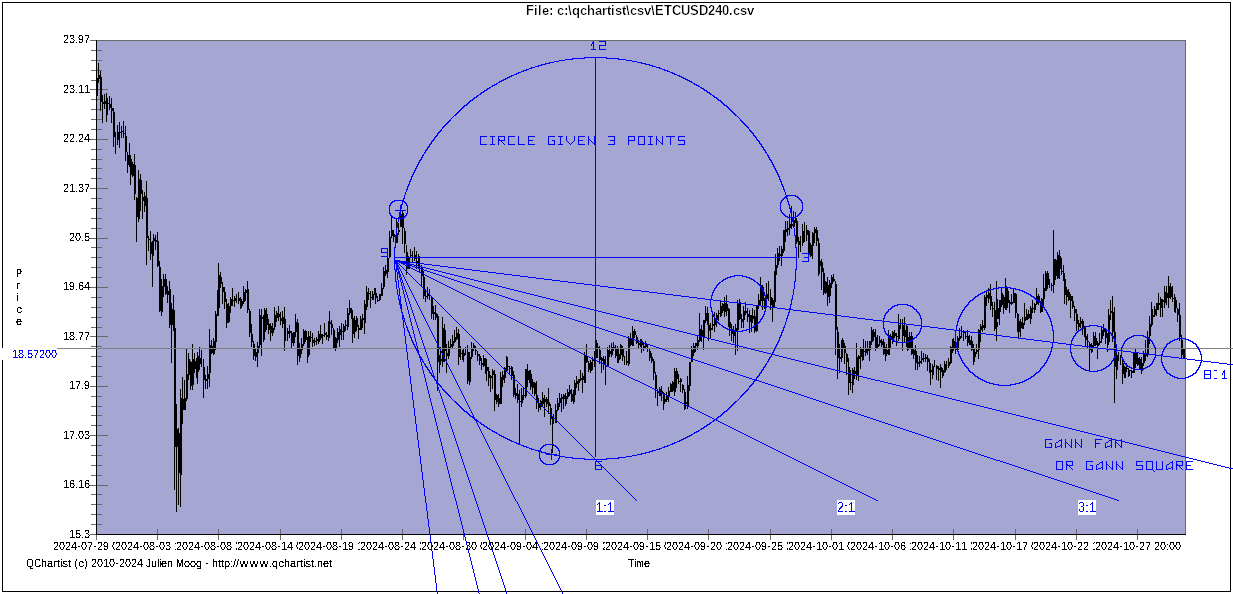
- Fibonacci Rotated rectangle method 1 or 2 in Settings (between 61.8 and 78.6) - (Hathaway https://help.optuma.com/kb/faq.php?cid=21 https://help.optuma.com/kb/faq.php?id=423) Triple Vector Concentric Circle + Drawing Tool from the Center of the Circle (or Parallels or Trend Line at 32.70 degrees (= 90 degrees - 1 Radian))
With the "Circle Given 3 Points" drawing tool.
- Moreover, we can also use scale dependant drawing tools to complete the analysis
Here are the indicators that you can use:
- Murrey Math Daily or Weekly red lines (use it imperatively)
Use it on 4H TF only if you trade indraday (use it imperatively)
- DVI_Valuechart OR TSF 225 (see Useful tip below) Daily or Weekly with drawing tools (optional if intraday)
- Average Monthly Range (ADR 1.13) near pink or light blue line (optional)
- Center of Gravity and Past Regression Deviated 225 on Monthly chart (optional)
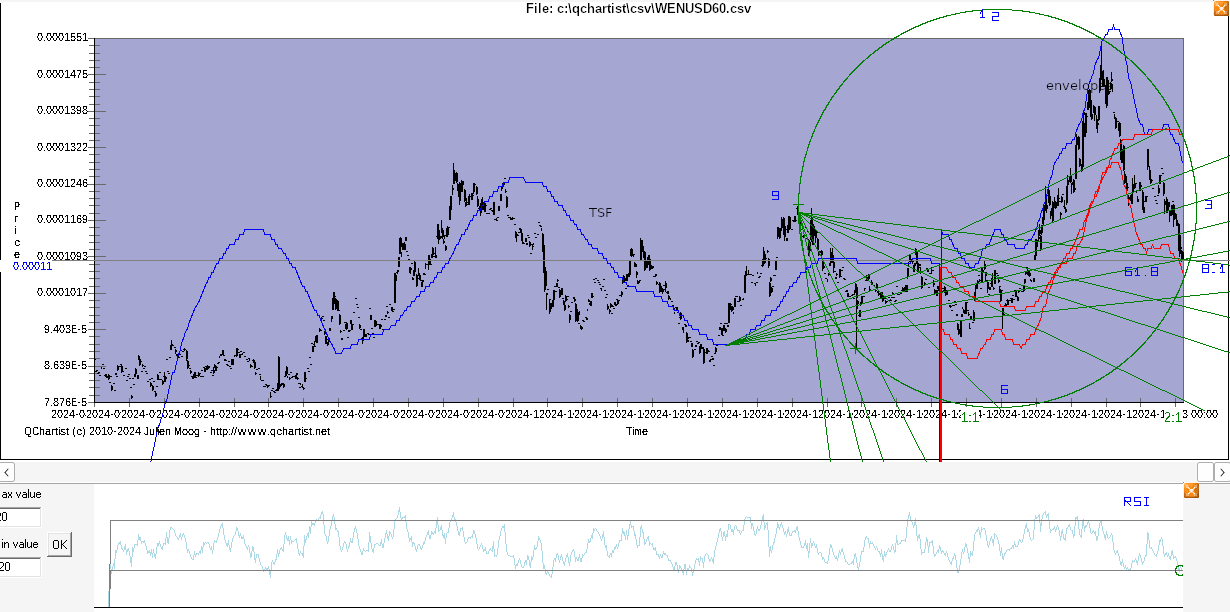
- Useful tip (use it imperatively) : use the Time Series Forecast (TSF 225) indicator on Daily or Weekly charts (increase bars back of the indicator and display 999 bars.) And draw "Gann Fan" or "Fibo Fan" with price mirror setting between Bottom - Top of the TSF curve in order to find turning points efficiently. Or with Fibo Retr., pentagram between bottom and top of TSF. (optional if intraday)
- Another powerful tool to complete the analysis is the use of the chart type Sinusoidal in the Menu Edit>Chart Conversions>Convert chart to Sinusoidal. On the Sinusoidal chart (varying from -1 to 1), we can use all scale independant and scale dependant drawing tools to complete the analysis. (optional)
- You can also use the Planet_Scale indicator on Weekly TF to find turning points. (optional)
- MogalefBands 4 Daily ,Weekly or Monthly (optional)
- Harmonic-Patterns, Search Patterns and Zup indicators (useful)
- Anchored VWAP channel top/bottom of channel with all bars on daily or more TF (useful because it is self similar on all timeframes)
- Cumulative Volume Delta CVD <=0 if we buy or >=0 if we sell
- Zup / Wolfe Wave
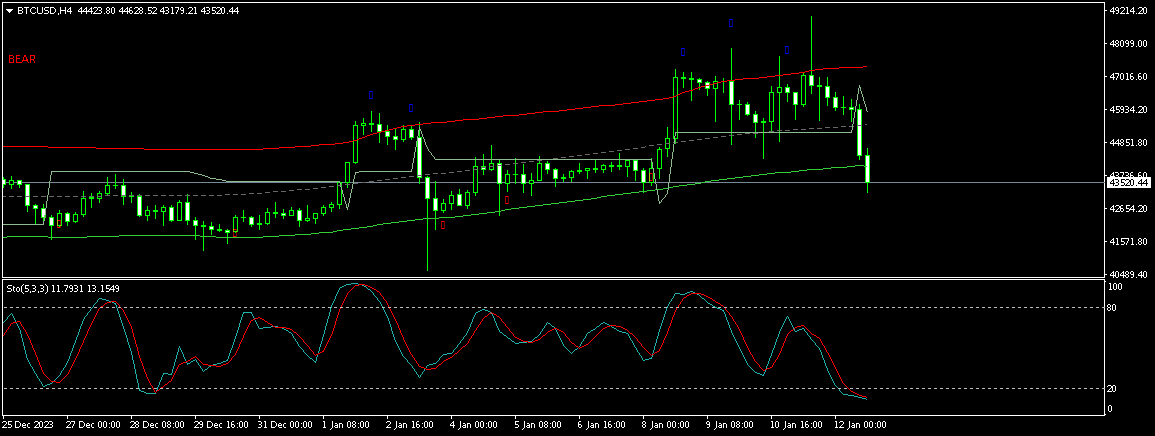
- Stochastic RSI (5,5,5) near 1/-1 on 4H TF (use it imperatively)
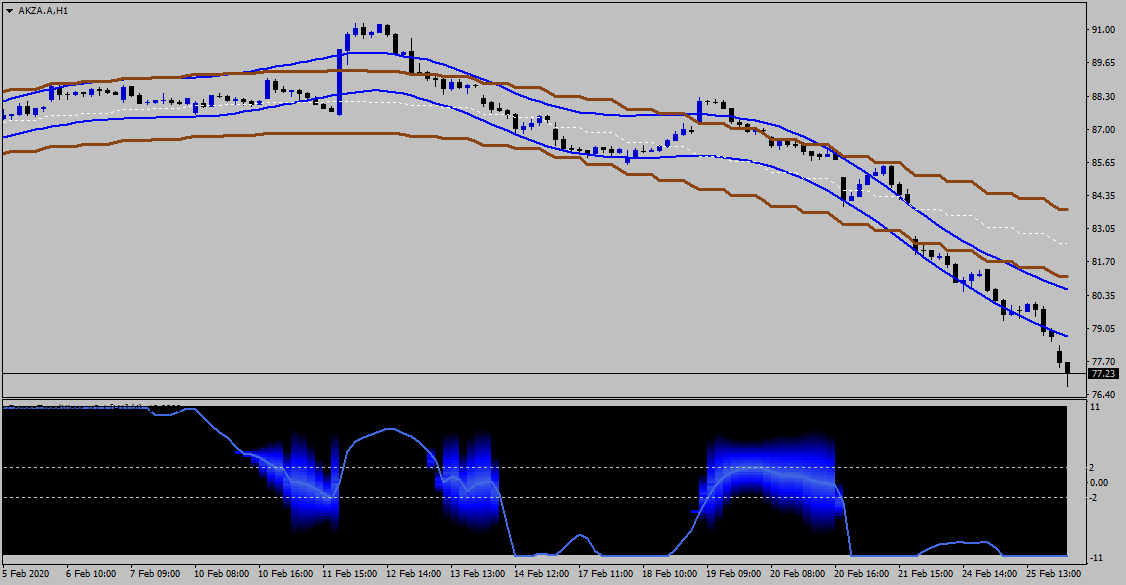
- CoronaTrendVigor Max/Min Flat -10/10 on 1H TF (use it imperatively)
- Spud2 >=90 or <=10 on 4H TF (use it imperatively)
- Price is near higher or lower band of DinFiboHigh cpp indicator on Daily TF (use it imperatively)
- You should also verify that the price is on top/bottom of Bollinger Bands and BB-HL and ATR Channel and Ma Chanels FiboEnv Mid and Din Fibo High and Past Regression Deviated Log on 5 min TF (use it imperatively)
- You should also verify that the price is on top/bottom of ATR Channel and Ma Chanels FiboEnv Mid indicators on 4H TF. (use it imperatively)
Exit when price is near Volatility.Pivot or when valuechart indicator is near 0 on 4H TF.
- If the price goes into the wrong direction, we wait for the price to reach the Murrey Math indicator +- 2/8 Ext Red Line on the 4H (240 minutes) timeframe ; and we enter again at that market price.
MogalefBands:
Time Series Forecast TSF with Gann Fans:
DVI_Valuechart with price expansions:
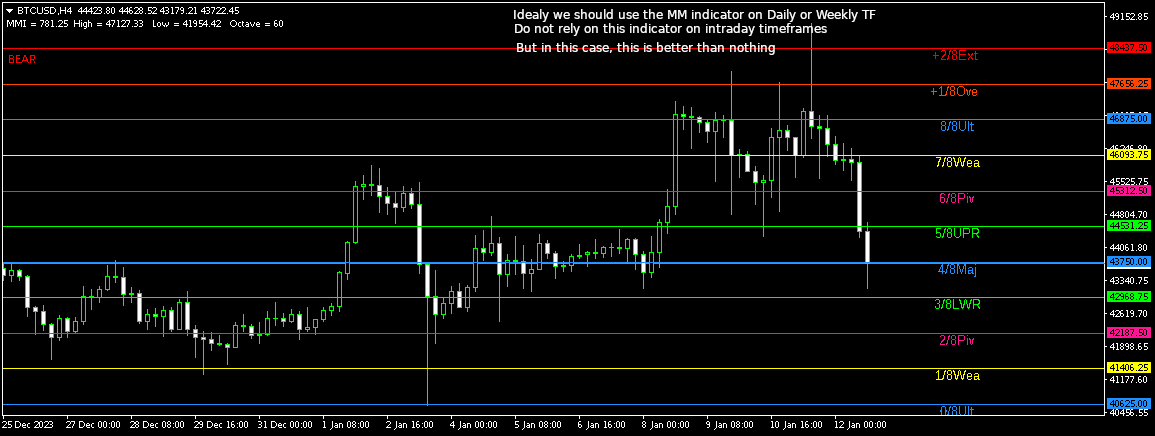
Murrey Math:
TMA_CG exit:
Very powerful: Circle given 3 points with Gann Fan or Gann Square on the quarters (cf. Michael S Jenkins and Scott Hathaway):
Please always use TD Sequential >= 9 in your system
Entry on 60 or 240 minutes TF, you should verify that the price is on top/bottom with:
Only what's in bold below is important (QChartist's Magic Hat Trick)
- Murrey Math +-2/8 1 hour TF Red line imperatively
- Always use TD Sequential >= 9
- Always wait for Weekly R1/S1 at least before entering
- RSI >=70 or <=30
- Useful tip (use it imperatively) : use the Time Series Forecast (TSF 225) indicator (increase bars back of the indicator and display 999 bars.) And draw "Gann Fan" or "Fibo Fan" with price mirror setting between Bottom - Top of the TSF curve in order to find turning points efficiently. Or with Fibo Retr., pentagram between bottom and top of TSF. (never enter if the line of pentagram that converges with the price is too vertical, only accept when the line is almost horizontal)
- (( Circle given 3 points with Gann Fan or Gann Square on the quarters (cf. Michael S Jenkins and Scott Hathaway)) or (drawing tools from system #3 example fibo diamond))
- Anchored VWAP channel h1 or 3h-h4 or daily or Weekly with all historical data available timeframe multiplier or period converter
- Sharpe Ratio indicator >=5 or <=-3 on one timeframe, for example on 30 minutes
- Ma Chanel FiboEnv Mid last band on 5 min TF or TSF with drawing tools
Then here is an idea to confirm your entry and follow your position:
Combining a Fast Fourier Transform (FFT) with the Hurst Cycles Spectrometer can be more powerful than using either one alone.
If your FFT and Hurst Cycles Spectrometer outputs are synchronized meaning they both highlight the same dominant cycle lengths at the same time that's a pretty strong signal in cycle analysis.
Both indicators are available for QChartist (separate canvas) fftspectro and spectrometer
All the rest is optional:
- Zup or Harmonic Patterns or Search Patterns (optional)
- Wolfe Waves with Zup (optional)
- ATR Chanels
- Ma Chanel Fibo Env Mid
- BB-HL
- Din Fibo High
- tsi indicator near 80 / -80
- spud2 near 90 / 10
- cyan_1 near 0.8 / -0.8
- Anchored VWAP channel
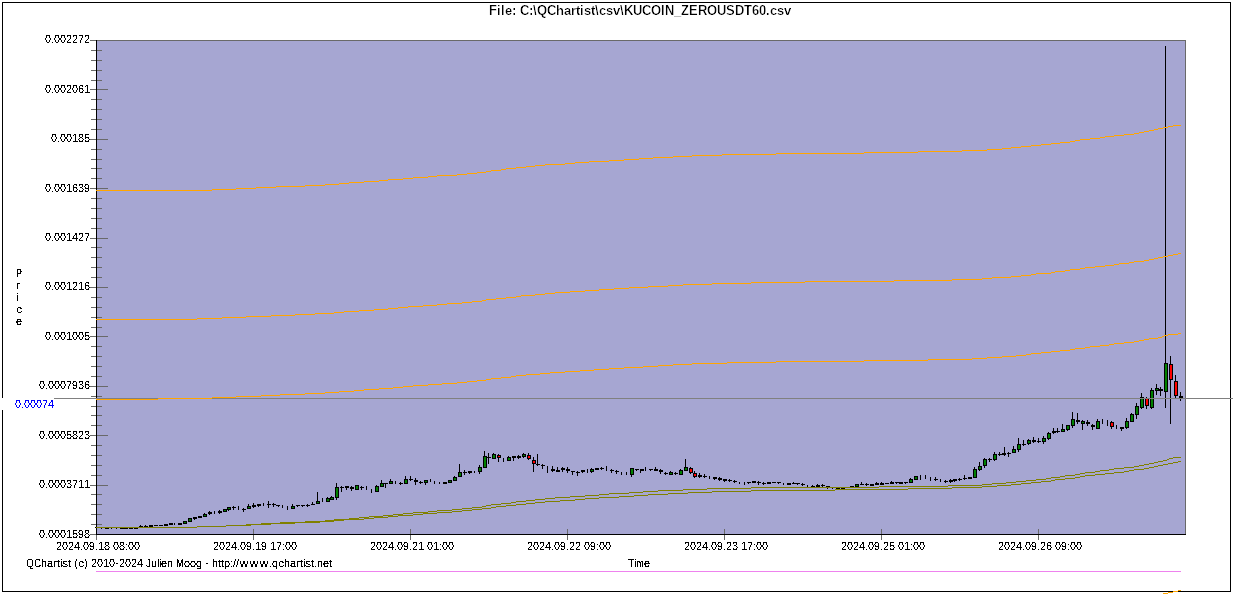
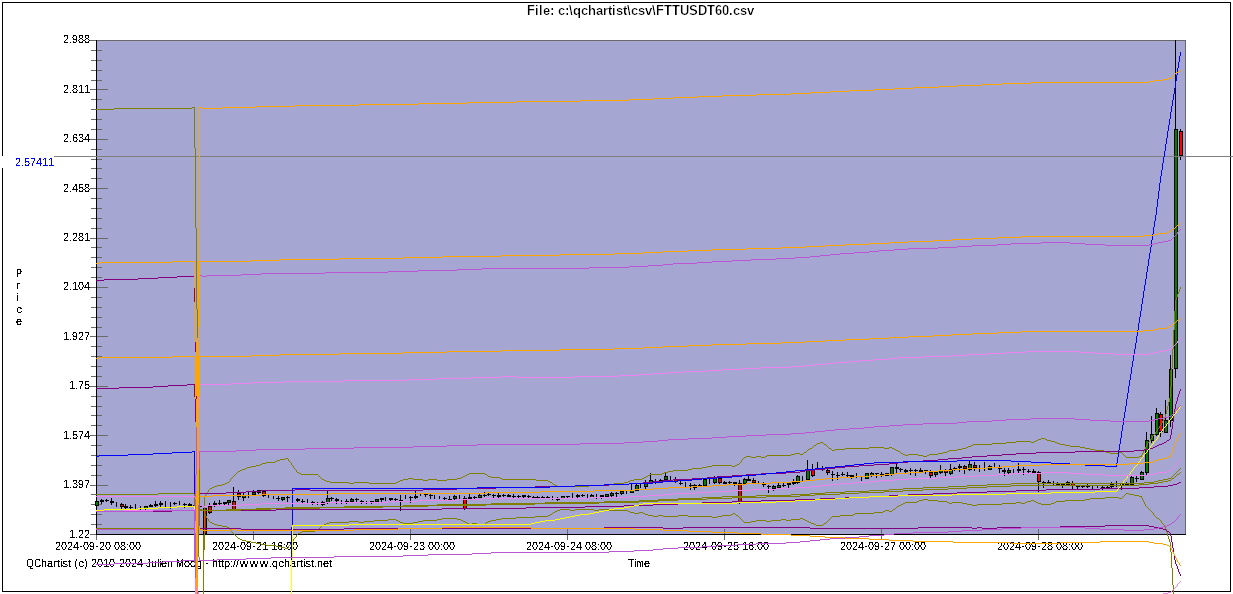
- VegasCpp Risk Model: always 1, fit the Point: to e.g. 0.000001 for ZERO, 0.001 for FTT so that the first orange line channel is near the current price (top for Ma Chanel Fibo Env Mid) and so that we will enter at the last (third) orange line channel (see ZEROUSDT60 and FTT pictures)
- It is also advised to use the Fibonacci Rotated rectangle method 1 or 2 in Settings (between 61.8 and 78.6) in complement to these indicators (see POPCAT and CVC examples of use)
For your entry, you should also verify that the price is on top/bottom on 5 or 15 minutes TF for confirmation with:
- BB-HL
- Past Regression Deviated Log 500
- ATR Chanels
- Din Fibo High
- Bolinger Bands 20 - Ma Chanel FiboEnv Mid
Do not use leverage (x1)
Exit: On 5 minutes or 15 minutes TF:
- Bollinger Bands 20 : price is near the Middle band
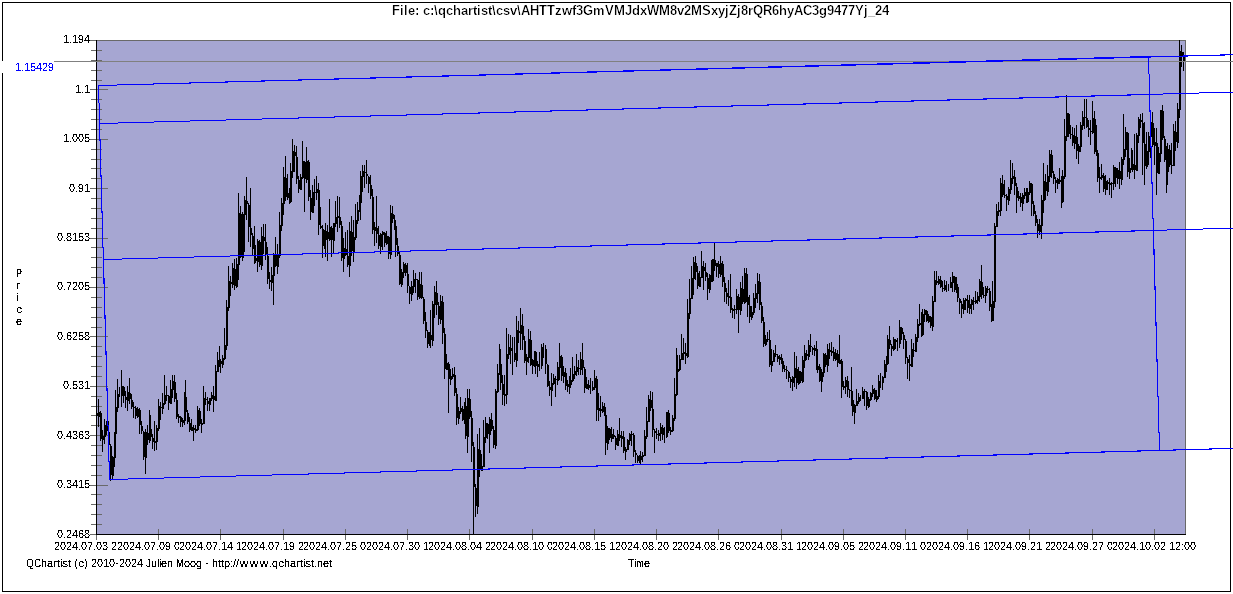
To find potential signals, check and sort your list of instruments by their % change for the last 24h or 7days
Also, take drastic mesures to avoid losses and liquidation:
--> Never use leverage or use minimum leverage x1 = less risk of liquidation
--> Use only a small part of your capital to invest (max 1/3)
Enter with another 1/3 in the market if you are in difficulty (no leverage or x1)
Enter with the last 1/3 in the market if you are very in difficulty (no leverage or x1)
--> Never close your position at Market Price because you will often loose money when you scalp, always use a TP (target price) or a SL (stop loss) to exit your trades
Application example: First enter 1 position without Vegas indi (with all other indis) with leverage x1 or minimum lev. with 1/3 of capital, then if you are negative, wait for the price to reach the third orange line of Vegas and enter another 1/3 of capital with a higher leverage. If you are still under water, wait for a higher/lower extremum and enter with 1/3 of capital.
Signal on 240 min TF:
Or signal on 60 or 240 min TF always use Vegas to find extremums:
Confirmation on 5 min TF:
Some geometry in complement to channels:
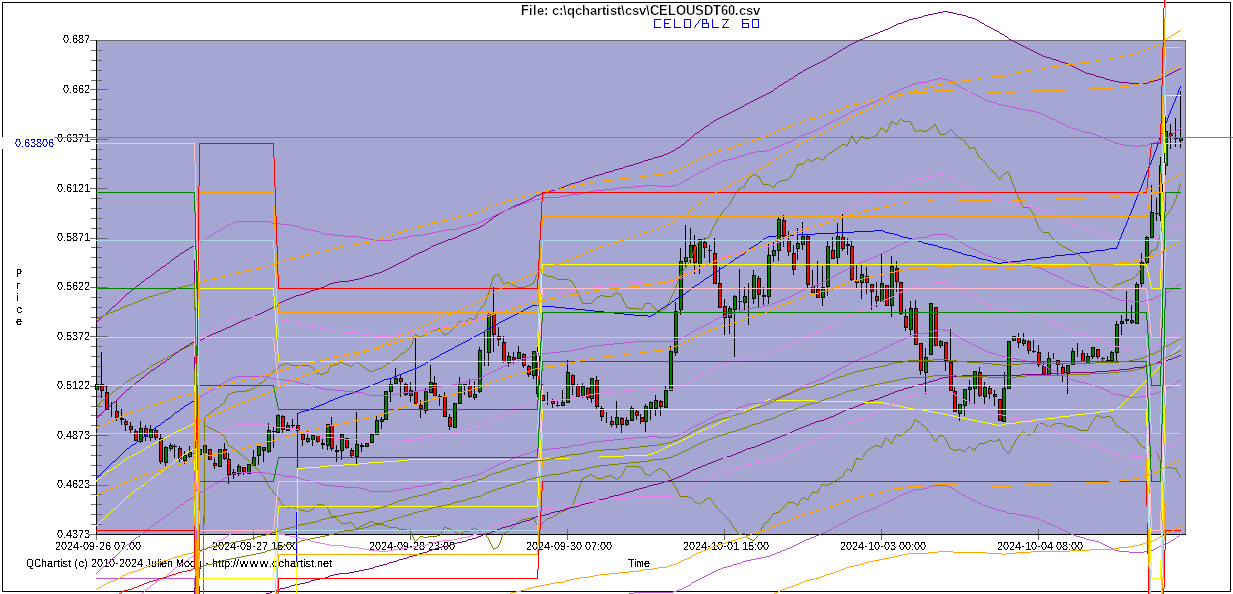
Another good application example of the system #3 and #4 : Analysis of the exotic pair Celo/Blz
- We use some of the fundamentals of the system #3 and system #4 for this analysis
- We never use leverage to avoid risk
- We create the exotic pair Celo/Blz 60 min with the Mixer tool of QChartist first
- We use the timeframe multiplier (60 min x 5) and the Attribute Timeframe function
- Fibonacci Rotated rectangle (Fib Channel or Fib Retracements or Draw Cross 1.618) (between 1.618 and 1.786)
- Spud2 >=90 or <=10 - Stochastic RSI >=1 or <=-1 (use it imperatively) - Sharpe Ratio >=5 or <=-3 (use it imperatively)
- Williams %R >=0 or <=-100 - Weekly Pivot above/below R3 or S3 (use it imperatively) - SwamiRSI <=0 or >=100 (use it imperatively) to avoid to be taken in a flash crash - Then look at Murrey Math orange-red lines (use it imperatively)
- CyAn 1 FT is near 0.8/-0.8 - Cumulative Volume Delta is high (e.g. >100k or <-100k) (use it imperatively) - Please use also the Anchored VWAP Channel which can be salutary (use it imperatively)
- Price above/below Anchored VWAP channel top/bottom of channel with all bars on daily or more TF (useful because it is self similar on all timeframes but not necessary)
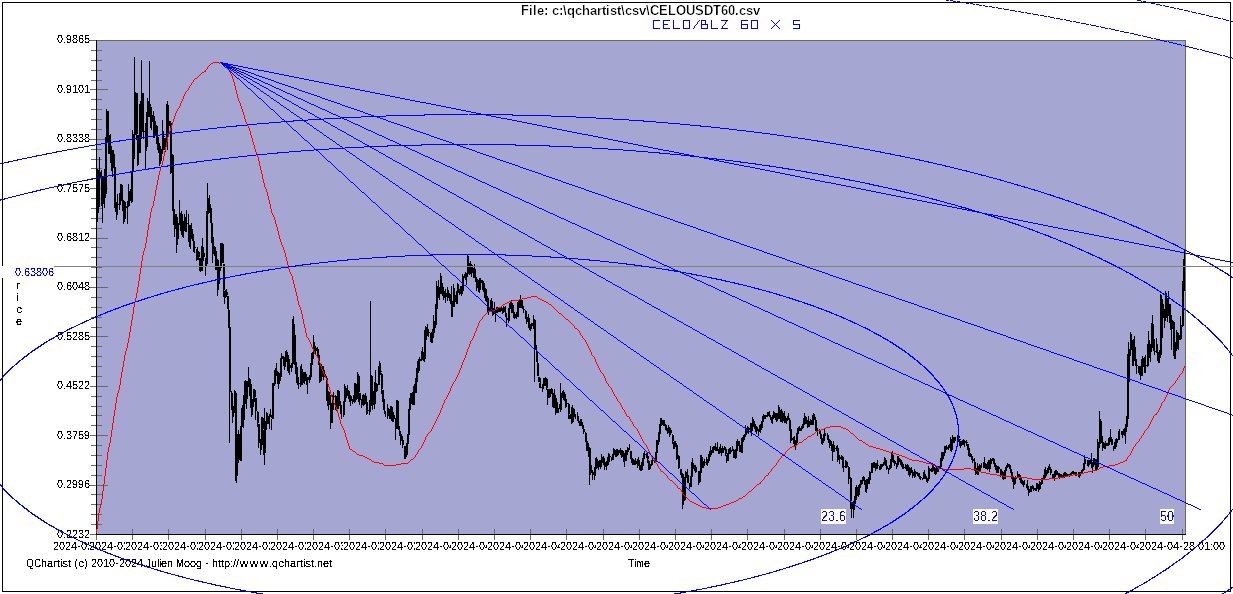
- Useful tip (not necessary) : use the Time Series Forecast (TSF 225) indicator on Daily or Weekly charts (increase bars back of the indicator and display 999 bars.) And draw "Gann Fan" or "Fibo Fan" or Gann Grid or (...) between Bottom/Top Bottom/top of the TSF curve in order to find turning points efficiently. Or with Fibo Retr., pentagram between bottom and top of TSF.
- 1 Harmonic pattern detected with Harmonic-Patterns, Search Patterns or Zup indicators (not necessary)
All the best
If my trading systems and software helped you to become a successful trader, please make a donation with the button below. Thank you!
The QChartist Suite takes a lot of time and expertise for its development. Your donation helps us to deliver better products! Thank you.


 - You can look at ZUP for a butterfly (not required)