


Features
- fast C++ computations
- astro libraries with
indicators and wheel interface
- easily programmable
with both Basic and C++
- many source examples
and all tools you need to extend functionnalities are on the website
- MT4 (MetaTrader 4)
indicators can be easily ported
- getting realtime
quotes (currencies, stocks) or data (temperature, ...) is possible and
free
- many (about 100) efficient
custom indicators are included
- indicators can use
multiple timeframes alltogether
- many drawing tools,
which are persistent and readjusted even when you scroll the chart
- many useful
functions that can be reused for new indicators, modules, improvements
- you can automate the
analysis process (scanners are available with QTGuard)
- automatic software updates can be enabled / disabled
- Pre Market data for US Stocks
- Compatible with Real Time intraday and more quotes from Yahoo Finance (stocks, indexes, commodities, currencies) and Alpha Vantage (currencies and stocks) (Create your free API key on the site) and EOD data from Stooq and Tiingo cryptocurrencies and IEX, Finnhub, GeckoTerminal crypto DEX
Revision after revision, QChartist
allows more and more functionalities. It is really a flexible software
with extensive functionalities.
- You can draw geometrical shapes:
- trendline
- Fibonacci fan and mirrored
- Fibonacci retracements
- horizontal line
- vertical line
- Parallel lines
- square from corner or center (with mosaic)
- triangle
- equilateral triangle from corner or center (with mosaic)
- rectangle
- circle
- cross
- inverted circle
- text
- Vector Text (with transparency and stretch and rotate)
- Andrews pitchforks
- ellipses (Phi ratio)
- Cycle lines
- Log/Exp curves
- Price/Time extensions
- sinusoids and rotated
- logarithmic / equiangular spiral
- pentagram
- angled cycle
- polygons : pentagone, hexagone, octogone
- conic from five points
- Gann grids
- Speed resistance lines (Fan) and mirrored
- Fibonacci arcs
- Seed Of Life
- Gann square
- Gann Box
- Gann Fan
- Fibonacci spiral
- Archimed spiral
- rotated ellipses
- Circle given 3 points
- Prime numbers
- Fibonacci Time and Price Zones
- Fibonacci Circles
- Schiff Pitchfork
- Time Ruler
- Price Ruler
- Fibonacci Diamonds
- Arrows
- Rotated Fibonacci Rectangles
- square of 9 and 144 floating
- You can put indicators on your
charts:
- Anchored VWAP
- Moving Averages
- Bollinger Bands
- bowels (MTF indicator with Pivots Supports Resistances Daily, Weekly and Monthly)
- Vegas Channel
- BB - HL
- ATR Channel
- Center Of Gravity COG
- Average Daily / Weekly / Monthly Range
- Pivot points supports and resistances
- COG of RSTL
- Din Fibo High
- Ehlers Fourier Transform
- Elliott Waves with 3_Level_ZZ_Semafor
- Harmonic_Patterns
- TD Sequential (thanks to Tom Demark)
- VWAP with volumes
- BabonH1 tpl with TriangularMA4H TriangularMA1H
- Envelopes
- Ichimoku
- Jupiter - Saturn cycle (planetary lines astro
indicator) also called the Chronocrator or master time factor
- Levels
- Logarithmic Regression Rainbow Chart
- MA Channels FiboEnv Mid
- Mogalef Bands
- Murrey Math (Fractals)
- Overlay Charts
- past regression deviated (Time Series Forecast TSF
channel)
- planetary lines
- planetsqn Chapter 15 Square of 9 Nine planet Sun on daily charts
- RSTL
- Fibo MA Channels
- Search_patterns (Harmonic Patterns)
- Spud2
- Square numbers lines
- Synodic cycle for all planets
- TMA - CG
- Time Series Forecast TSF
- Volatility Pivot
- Volatility Stop
- WaterLevel
- Weekly Pivot
- Monthly (Yearly) Pivot
- MonthlyPivot2 (the real one)
- Moon Phases on chart
- Hurst FLD's - Future Lines of Demarcation
- Prime Numbers Spiral (Polar) ToolBox
- ZigZag
- ztrendline slope Pi ratio
- Zup Harmonic Patterns
- Python indicators: alma,dema,ema,fwma,hma,kama,jma,ma,pwma,rma,sma,swma,t3,tma,trima,vidya,wma,zlma,accbands,bbands,hilo,kc,supertrend,aberration,amat,cksp,psar,vwma,...
- You can put indicators on the separate canvas:
- Accelerator
- Money Flow Index MFI
- Average True Range ATR
- Value Chart (detrend price oscillator)
- Relative Strength Index RSI
- astro retrograde
- Candle Average
- CoronaSwingPosition
- Corona Trend Vigor
- declination system
- Ehlers fisher transform
- energy
- FFT (Fast Fourier Transform) spectrometer
- Force index
- Gauquelin sector (astro)
- j_tpo
- Volume
- LSS
- Moon scale
- planetary speed
- planet scale from W D Gann
- RBCI
- realMACD
- spectrometer (J M Hurst Cycles)
- stepftvcprdl
- StepRSI
- Stochastic
- stochasticRSI
- ValueChartATRChannels
- various oscillators
- VWAP Oscillator
- SwamiRSI
- RD_Combo
- Directional Volume Index
- RVI
- ADX
- MACDonRSI
- LaguerreRSI
- Moon Phases
- PlanetCycles (Show the Angle (Aspect) between the two selected planets)
- TSCD (Time Series Convergence Divergence)
- Value Chart of ATR Channels
Python indicators: obv,rsx,uo,vhf,zscore,stochrsi,cmf,ad,apo,ui,obv,...
- Weighted WCCI
- You can make charts additions, subtractions, multiplication, division
(Click on Mixer)
- You can use a logarithmic axis type
- You can lock the Price-Time Relationship with a specified ratio
- You can export separate indicators buffers data to csv files
- You can change the chart type to candlesticks, line, point, polar,
astro wheel...
- You can use custom timeframes (Period Converter)
- You can create your own experts which will analyse your charts
automatically and alert you for a signal
- You can use Scilab (a free Matlab
alternative) with QChartist
- Real time Market Watchlist live and customizable
- Live charts for tousands of tickers (symbols) that can be automatically refreshed
- Support of Python, Pandas, Pandas-TA and its 130 indicators, numpy, mplfinance, matplotlib, taleb, scipy, [...] for professional charting, calculation and research
- QChartist is compiled with RapidQ and
MinGW together
- And many many more features...
The source code of QChartist is fully included for multiple reasons :
- portions of code written under the GPL license belong to their
respective authors
- this will allow many programmers to contribute to the project and to
improve it
- in order to include new indicators in the program, the entire source
code must be recompiled
Since QC is delivered with its entire source code, compiler,
programming guide, and IDLE, it is very easy and rapid to extend its
possibilities, even for novice programmers.
Configuration required:
Windows 9x, NT, 2000, XP, Me,Vista, 7, 8, 10, 11 or Linux WineHQ from 1.2 to 7.0
Thank you for using and supporting my software! I hope you like it and
find it useful.
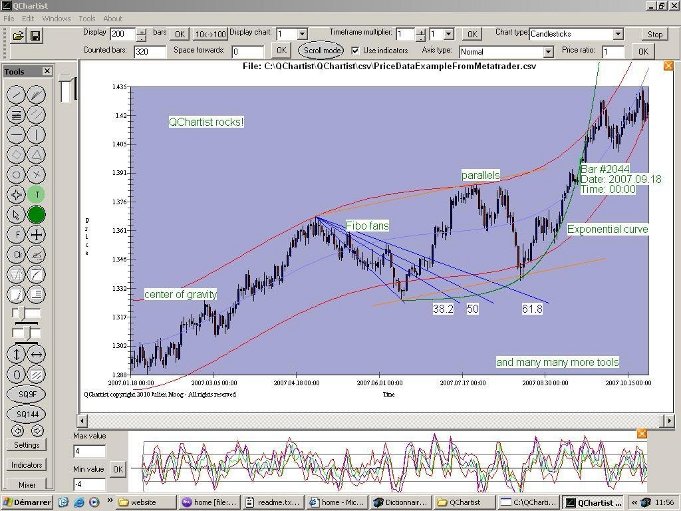
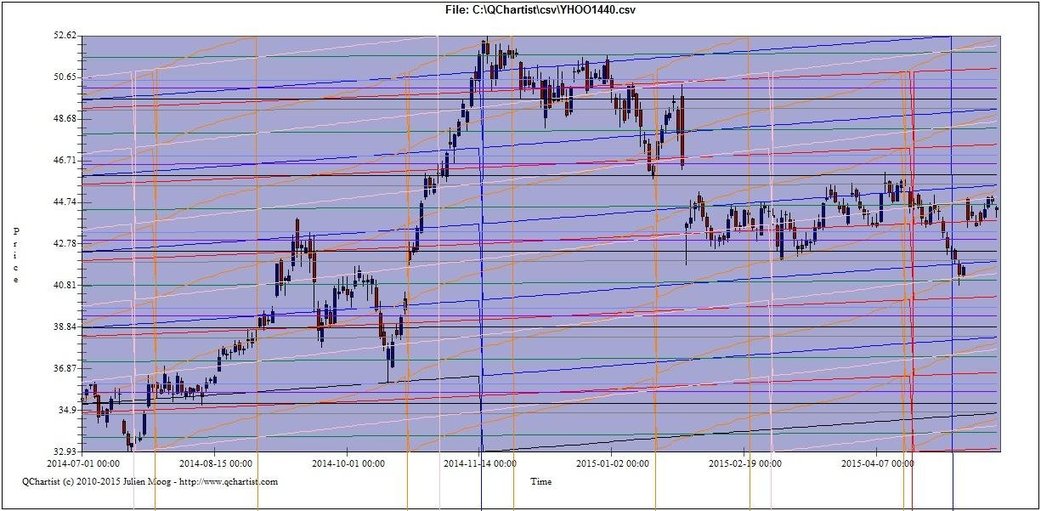
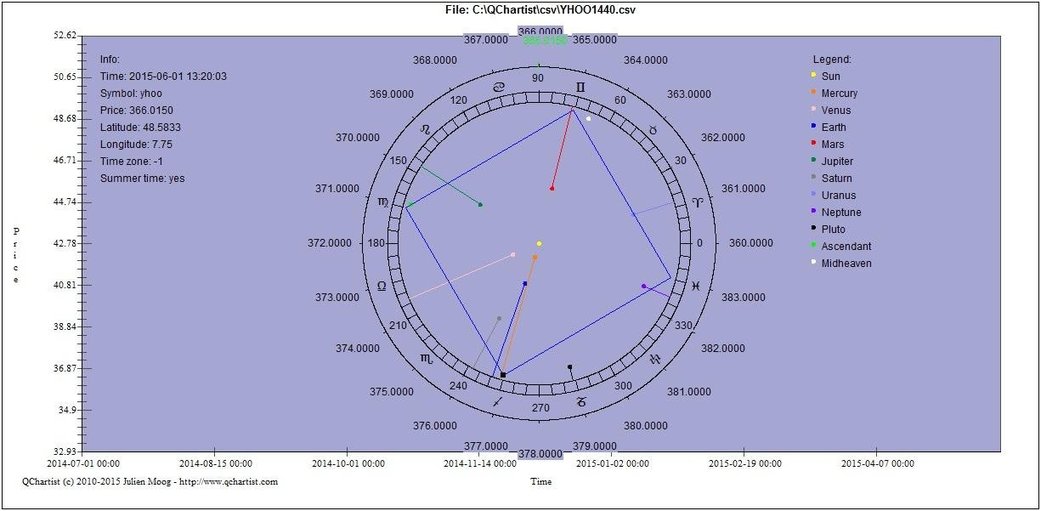
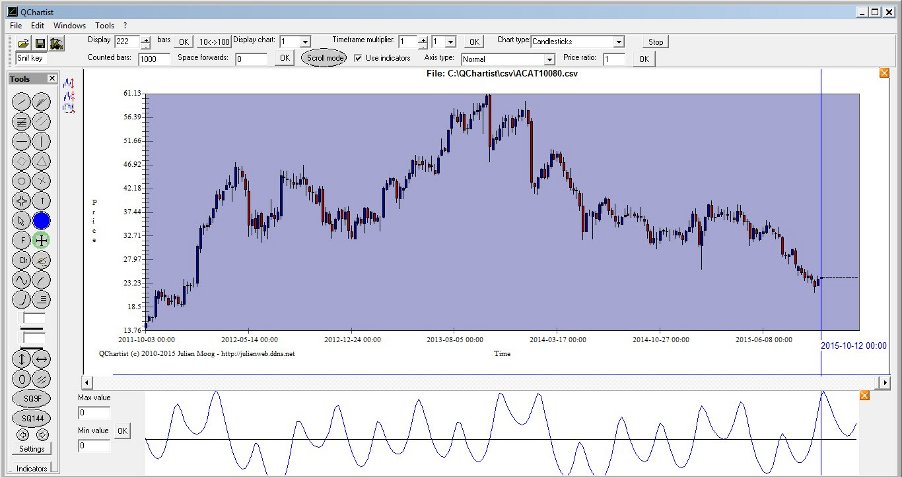
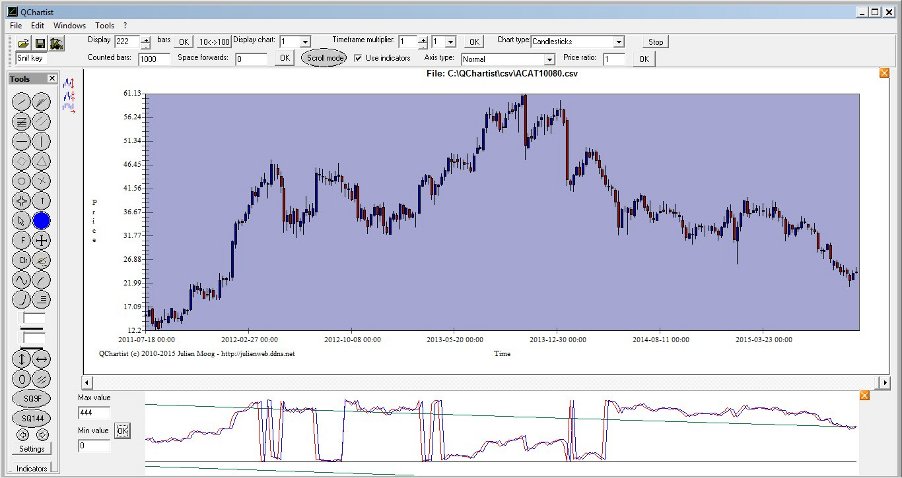
Screenshots :
Generic indicators :
Planetary lines astro indicator :
Astro wheel :
Declination astro indicator :
Planet scale astro indicator :
QChartist TA Software package box :

free charting software free stock market software free stock analysis tools technical analysis software free download free technical analysis software free forex charting software free charting platform best charting software free charting tools best technical analysis software real time charting software open source technical analysis software best stock charting software best forex charting software free stock market analysis software best free stock analysis software best free technical analysis software stock analysis software free free forex chart analysis software open source charting software best trading chart software free trading chart software free stock charting platform best free stock charting software stock market technical analysis software free download best charting software for day trading free technical analysis charting software best free charting software best stock market charting software free chart analysis software professional charting software best chart analysis software best free charting software for day trading best stock market technical analysis software best free stock analysis tools free stock market analysis tools free chart software for stock market free charting software for stocks best charting software for trading
|