Finishing a big project can feel surprisingly strange — a mix of relief, pride, and sometimes a bit of emptiness. That’s completely normal.
Don’t rush past the finish line. Take a moment to:
reflect on what you achieved
recognize the effort you put in
celebrate in a way that feels good to you
Closing the chapter properly helps your mind move on.
Expect the “post-project dip”
After working toward a clear goal, it’s common to feel a drop in motivation or energy. You had structure and purpose — now there’s a gap.
👉 This isn’t a problem, just a transition phase.
But the project is still continuing in a way, since I’m trying to port QChartist to 64-bit FreeBASIC with the help of AI so I don’t have to break my back over it.
Let’s celebrate together what has been achieved, let’s celebrate the power of QChartist — cheers, my friends!🍸
i added example4.py i tried example4.py : error… python -m pip uninstall numpy pandas pandas-ta-classic python -m pip install numpy==1.19.5 python -m pip install pandas==1.1.5 python -m pip install pandas-ta-classic –no-deps python -m pip install python-dateutil pytz python -m pip list python -m pip install mplfinance –no-deps python -m pip install matplotlib==3.3.4 python -m pip install taleb –no-deps In your code, you just use import taleb as talib and it works the same way. python -m pip install scipy==1.9.1 –no-deps
now i tried : python example4.py “YHOO1440.csv” “2014-01-01 00:00” “2 015-06-01 16:00″ yes and yes it works, i managed to use pandas_ta on python 32-bit ! Chart saved as custom_chart.bmp and custom_chart.png
What is example4.py (which needs pandas): This script is a command-line financial analysis tool designed to process stock/forex data from a CSV file, apply various technical indicators from two different libraries, and generate a visual candlestick chart saved as a high-compatibility image (.bmp).
Globally, the script operates in four distinct phases:
Data Initialization and Filtering
The script starts by taking four command-line arguments: a CSV filename, a start date, an end date, and a toggle for volume.
It loads the CSV into a Pandas DataFrame.

It standardizes the columns to Open, High, Low, Close, and Volume.

It filters the data to only include the date range you specified in the terminal.
Indicator Discovery
The script performs a “deep scan” of your installed libraries to see what tools are available:
pandas-ta-classic: It uses the inspect module to find every available function inside the library.

taleb (TA-Lib): It similarly scans for all uppercase built-in functions (standard for TA-Lib indicators like RSI, MACD, etc.).

It then prints a massive list of all combined indicators found so you know what you can choose from.
Interactive Configuration
This is the “human-in-the-loop” part of the script:
Selection: It prompts you to type which indicators you want (e.g., sma, rsi, bbands).

Parameters: For every indicator you pick, it displays the help documentation for that specific function and asks you for parameters (like length=20).

Calculation: It runs the math and appends the new data (the indicator values) as new columns in your main DataFrame.
Smart Visualization (Mplfinance)
The final phase is the most complex part of the code logic:
Panel Management: It automatically decides where to draw the indicators.

    Overlays: Indicators like Moving Averages or Bollinger Bands are drawn directly on top of the price candles (Panel 0).

    Oscillators: Indicators like RSI or MACD are given their own separate "panels" below the price chart so they don't clutter the main view.

Image Export: Instead of just popping up a window (which can be difficult in a Wine environment), it generates a plot, saves it as a .png, and then converts it to a .bmp. This is likely done for compatibility with older Windows image viewers or specific legacy software.
Pandas-TA is a popular and comprehensive Technical Analysis Library in Python 3 that leverages numba and numpy for accuracy and performance, and pandas for simplicity and bulk processing. The library contains more than 150 indicators and utilities as well as 60 Candlestick Patterns when TA Lib is installed.
Now thats a very good news that example4.py script works because we’ll be able to add and use all 130 Indicators and Utility functions from pandas ta to QChartist and much more ! More info here: https://github.com/Data-Analisis/Technical-Analysis-Indicators—Pandas
i tried : c:\QChartist\Python38-32>python example10.py YHOO1440.csv “2015-09-01 00:00” “20 16-02-01 00:00″ Saved chart to: full_chart.ps To convert to PNG, use: gs -dSAFER -dBATCH -dNOPAUSE -sDEVICE=pngalpha -r144 -sOutputFile=full_chart.p ng full_chart.ps to obtain a 1h chart: use python pcgeck.py with command line arguments –interval 5min –days 33 then use period converter of 12 in qchartist to obtain a 4h chart : use python pcgeck.py with command line arguments –interval 15min –days 90 then use period converter of 16 in qchartist to obtain a daily chart : use the obtained 4h chart and use period converter of 6 in qchartist
pcgeck.py : This script is a Python tool designed to fetch historical market data for a specific cryptocurrency from the CoinGecko API and convert it into a structured OHLCV (Open, High, Low, Close, Volume) format saved as a CSV file.
example10.py : This script is a data visualization tool that generates a stock or cryptocurrency chart from a CSV file. It not only plots the primary price data but also calculates and overlays common technical analysis indicators.
binancevol.py : This script is a data acquisition tool that connects to the Binance Futures API to download historical market data for a specific trading pair. This Script (binancevol.py) acts as a specialized data collector specifically for Binance Futures, providing a more granular view of order flow (Buy vs. Sell pressure) which isn’t present in your general CoinGecko data.
binancefetch.py : The script binancefetch.py is a specialized data acquisition tool designed to fetch historical OHLCV (Open, High, Low, Close, Volume) market data from the Binance REST API and save it to a CSV file. Volume Split: A core feature of this script is the calculation of Buy Volume and Sell Volume. It takes the total volume and the “Taker buy base asset volume” provided by the API to separate trading activity into distinct buying and selling pressure metrics.
okx.py This script (okx.py) is a data-collection and aggregation tool designed to analyze recent trading activity for a cryptocurrency pair on the OKX exchange. Global Functionality Globally, the script fetches raw individual trade data, organizes it into 1-minute intervals, and calculates buying versus selling pressure to identify market trends.
All these python script will be useful to implement and integrate new professional grade functionalities to QChartist TA software for the future releases, for example tick data and trades data information, order book and order flow analysis, volume footprint charts and much more !
The Cumulative Volume Delta (CVD) is an absolutely fundamental tool for many professional traders, especially those specializing in Day Trading or Scalping in high-liquidity markets (Futures, Crypto, Forex).
Unlike lagging indicators based on price (such as RSI or MACD), CVD gets to the root of market movement: Order Flow.
Why do professionals use it?
CVD measures the net difference between aggressive buying volume (market orders) and aggressive selling volume. While price shows where the market is, CVD shows who is in control.
Identifying Absorption: This is its most powerful use. If the price is dropping while the CVD is rising, it means large “passive” buyers are absorbing all the aggressive selling. This is often a sign of an imminent reversal.
Confirming Trend Strength: In a healthy trend, price and CVD move up together. If the price climbs but the CVD flattens or drops, the trend is losing steam—buyers are no longer “hitting the tape” aggressively.
Spotting Divergences: Pros track divergences between price peaks and CVD peaks to anticipate false breakouts (bull traps/bear traps).
Who specifically uses it?
Footprint Traders: They use CVD alongside Footprint charts to see the cumulative pressure over an entire session.
Futures Traders (Indices/Gold/Oil): On these centralized exchanges, volume data is precise, making the CVD extremely reliable.
Crypto Traders: Given the volatility and the heavy impact of market orders and liquidations in crypto, CVD has become an industry standard.
Limitations to keep in mind
While powerful, CVD is not a magic formula. It does not account for limit orders (passive liquidity) that have not yet been executed. A CVD exploding to the upside can still crash against a “wall” of hidden sell orders that are only visible on an Order Book or a Heatmap.
Pro Tip: CVD is most effective on lower timeframes (Intraday). On longer horizons (Weekly/Monthly), its utility diminishes as the delta tends to mean-revert or wash out over time.
Good news: QChartist now integrates order flow indicator CVD in build 324 ! Change Log: 2026-02-12:
New indicator for separate canvas: CVD (Cumulative Volume Delta) To make the indicator work, please first put the value of “counted bars:” (cntbarsedit) from 1000 to 3000 ; then you have to load your symbol on 3 timeframes : Daily TF,1 Minute TF and 1 Hour TF (we visualize it on 1H) Dont forget to put counted bars back to 1000 after using this indicator I made this indicator greatly with the help of AI chat bot and it made me save a lot of time. On small caps cryptos, CVD should be >100k/<-100k before expecting a significant reversal
Recommended trading system improved in the trading_system.zip file
build 323
2026-03-11:
Fixed the CVD indicator, now it displays correct values To make the indicator work, please first put the value of “counted bars:” (cntbarsedit) from 1000 to 3000 ; then you have to load your symbol on 3 timeframes : Daily TF,1 Minute TF and 1 Hour TF (we visualize it on 1H) Dont forget to put counted bars back to 1000 after using this indicator On small caps cryptos, CVD should be >100k/<-100k before expecting a significant reversal
Recommended trading system improved in the trading_system.zip file
Decreased tfintervalh1 value to 17280000 in QChartist.ini the way latest bars are correctly downloaded on 1H charts (please note that you’ll have to save and restore your data source api keys in a safe place for this update)
build 324
The approximation of CVD indicator in QChartist assumes that the Conviction of a candle represents the Delta of that period. It typically uses the lowest timeframe available (M1) to build the data for higher timeframes (like H1 or D1).
Why Approximation is “Good Enough”
While it isn’t “True Delta” (which requires a Centralized Exchange like the CME), approximation is highly effective because of Arbitrage. Because high-frequency trading bots link the Spot FX or crypto market (which you trade) to the Futures market (where real Delta happens), the price movement on your QChartist chart almost perfectly mirrors the aggressive buying/selling on the exchange. Therefore, a green M1 candle on QChartist is a very reliable signal that aggressive buying occurred on the Futures exchange.
Since you know the M1 candle is a proxy for aggressive orders:
CVD Rising + Price Rising: Healthy trend (Aggressors are pushing and succeeding).
CVD Falling + Price Rising: Exhaustion (Aggressors are stopping, price is moving on low liquidity).
CVD Flat + Price Moving: Low conviction (The “Big Money” isn’t participating in the move).
“As humanoid robots with artificial intelligence start replacing human labor, we will no longer need to work to produce everyday goods. It only makes sense, then, that everyone on this planet should receive a guaranteed income of at least the minimum wage, without having to work. This is why we need a Crypto Pension Fund to distribute this money to all individuals.”
🌍 QChartist TA Attracts New Users from Around the World Every Day
Every day, new people from across the globe discover and download QChartist TA. This is no coincidence — it reflects the growing appeal of a free, powerful, and accessible tool that truly meets the needs of traders, analysts, and market enthusiasts.
QChartist TA is no longer just software — it’s a global community in motion. Users from Europe, Asia, Africa, and the Americas come together around a shared passion: understanding, analyzing, and anticipating market movements through a clear, efficient, and ever-evolving interface.
This daily success illustrates a simple truth: 👉 Users are looking for transparent, effective, and open tools. 👉 QChartist TA meets that need by offering freedom, precision, and collaboration.
The future is being written with everyone who joins this journey. Thank you to this worldwide community that grows day after day — proof that the passion for technical analysis knows no borders. 🌐📊
Companies like Avast boast of protecting users from web threats with their anti-virus. Now this same company is trying to find holes in my site by injecting all kinds of hacker requests to try to flatten it. It seems that all they know to do is to destroy the work of content creators on the web. They supposedly want to protect users from threats whereas they are the ones who threaten content creators. They are professional scammers.
An exe file is a Windows executable file, and it is used to run programs on your computer. Android doesn’t recognize .exe files, as it’s a different operating system than Windows. If so, can you run exe files on an Android device?
It is possible to run exe files on your Android smartphone without rooting. There are many third-party tools available that allow you to execute exe files directly on your Android phone.
Method #1: Use ExaGear Emulator to Run Exe Files
ExaGear is an emulator that allows you to run Windows exe files directly on your Android phone without rooting. However, programs and games with high requirements may not be compatible, such as Microsoft Office.
But, you can install several Windows exe programs including VLC, NotePad++, Audacity, and more.
Just follow these simple steps to enjoy your favorite Windows programs on Android.
Step #1: Download ExaGear And ZArchiver Apps
ExaGear emulator is not officially available on the Google Play Store, however, you can follow this link to download the ZIP file of this app easily.
ZArchiver app is needed to extract the downloaded ZIP file. You can also use any other file extractor app, such as RAR for Android, WinZip, or Android’s built-in file manager.
Step #2: Unzip Exagear Windows Emulator
Once you have installed the ZArchiver, or any similar app, open it on your mobile app development phone.
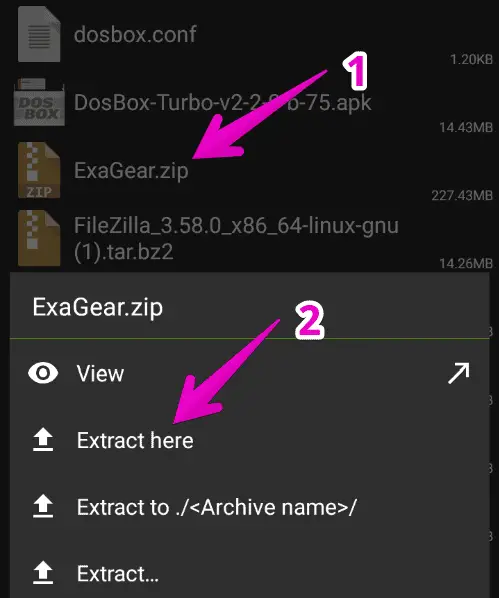
Then, navigate to the Download folder to locate the downloaded ExaGear ZIP file.
Tap on the ExaGear.zip file and select Extract here.
A new folder will be created to store the extracted files.
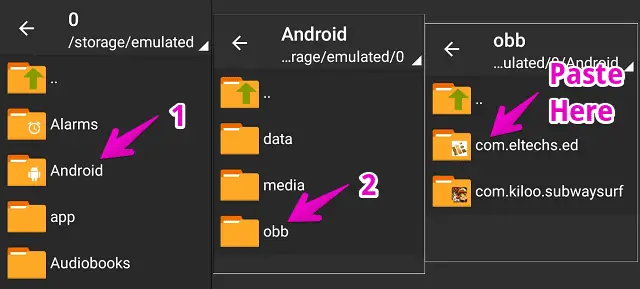
Step #3: Change the Files Path And Grant Permission
Now, open the extracted ExaGear folder which will have two items. Simply, copy the folder named “com.eltechs.ed”
Then, go to Android > open OBB folder, and paste the copied folder here.
Make sure to copy the folder in exact same path.
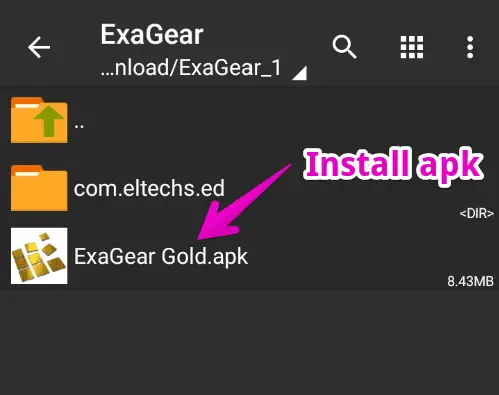
Step #4: Install ExaGear PC Emulator on Android
Once the folder is copied, we can now install the ExaGear app. Open the extracted ExaGear folder again.
Tap on the ExaGear Gold APK file and install it.
You may need to enable unknown source installation from settings before installing this app as it’s unavailable on the Play Store.
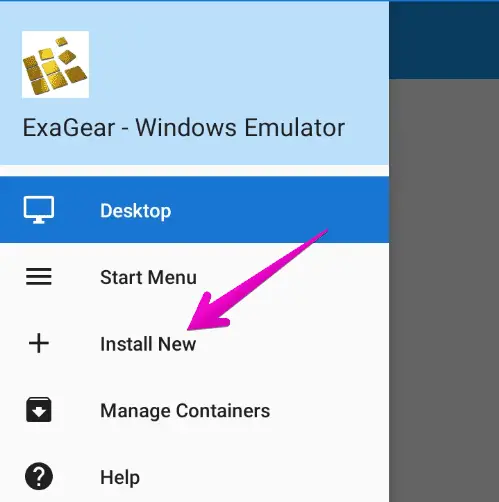
Step #5: Install Windows Exe Files
Until now, the ExaGear app must be installed on your phone. Now, we’re ready to install our Windows exe file on it.
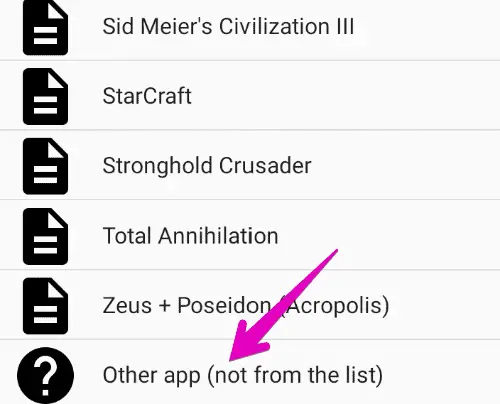
Launch this app > Tap three horizontal lines ☰ located at the top-left corner of the screen > Select Install New.
Swipe down and select Other app (not from the list) then, locate the exe file you want to install.
The installation process is the same as on a desktop PC.
If you face any error while installing the executable file, try downloading its lower version since it’s not able to install all heavy Windows software.
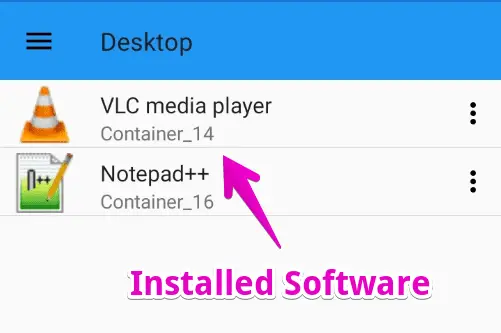
Step #6: Run The Installed Executable Program
Once the exe program installation process is completed, you can now run it on your Android device.
To do so, open the ExaGear app and you’ll find the installed exe files on the front.
Just tap on it and the application will launch.
This way, you can easily run your favorite Windows programs directly on an Android device.