- major bug with the Data Source for ALL providers solved
- Added WolfeWave mode for Zup
Only ray trendlines are drawn on the chart
Run update or download the software on the official website.
Thank you for using our software.
Enjoy !
February 8, 2024
QChartist build 294 is available !
February 5, 2024
QChartist build 293 is available !
QChartist build 293 is available !
- Improved docs
- New harmonic patterns indis
- New functions and constants
- Major bug in Data Sources solved
Now all indicators work perfectly
Run update or download the last version from the website
Thanks for using our software.
Enjoy !
January 14, 2024
QChartist build 287 is out!
QChartist build 287 is out!
- new basic functions and subs : ObjectDelete, ObjectGet, ObjectCreate, ObjectFind, ObjectSetText, ihighest, ilowest, itype, iopen, ihigh, ilow, iclose, timeb
- new indicator : Harmonic_Patterns
Please run update and recompile with QTStart
Enjoy!
January 5, 2024
How To Run Exe Files On Android Devices?
An exe file is a Windows executable file, and it is used to run programs on your computer. Android doesn’t recognize .exe files, as it’s a different operating system than Windows. If so, can you run exe files on an Android device?
It is possible to run exe files on your Android smartphone without rooting. There are many third-party tools available that allow you to execute exe files directly on your Android phone.
Method #1: Use ExaGear Emulator to Run Exe Files
ExaGear is an emulator that allows you to run Windows exe files directly on your Android phone without rooting. However, programs and games with high requirements may not be compatible, such as Microsoft Office.
But, you can install several Windows exe programs including VLC, NotePad++, Audacity, and more.
Just follow these simple steps to enjoy your favorite Windows programs on Android.
Step #1: Download ExaGear And ZArchiver Apps
ExaGear emulator is not officially available on the Google Play Store, however, you can follow this link to download the ZIP file of this app easily.
ZArchiver app is needed to extract the downloaded ZIP file. You can also use any other file extractor app, such as RAR for Android, WinZip, or Android’s built-in file manager.
Step #2: Unzip Exagear Windows Emulator
Once you have installed the ZArchiver, or any similar app, open it on your mobile app development phone.
Then, navigate to the Download folder to locate the downloaded ExaGear ZIP file.
Tap on the ExaGear.zip file and select Extract here.
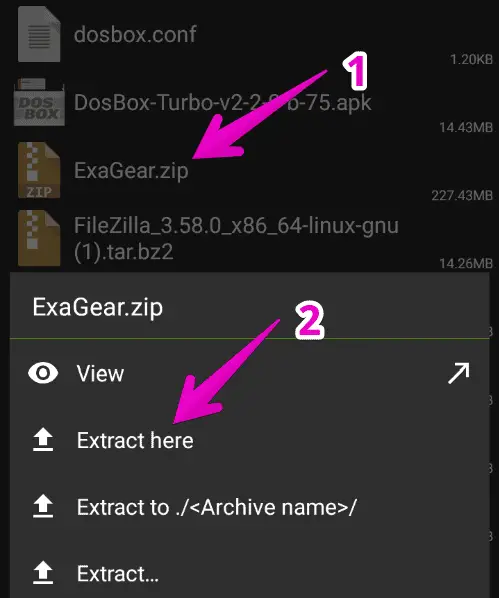
A new folder will be created to store the extracted files.
Step #3: Change the Files Path And Grant Permission
Now, open the extracted ExaGear folder which will have two items. Simply, copy the folder named “com.eltechs.ed”

Then, go to Android > open OBB folder, and paste the copied folder here.
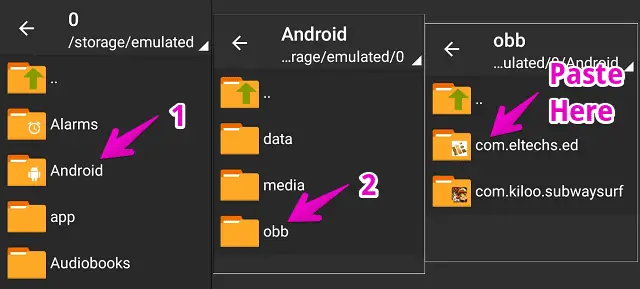
Make sure to copy the folder in exact same path.
Step #4: Install ExaGear PC Emulator on Android
Once the folder is copied, we can now install the ExaGear app. Open the extracted ExaGear folder again.
Tap on the ExaGear Gold APK file and install it.
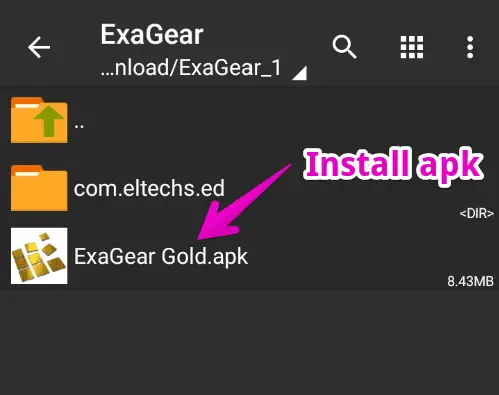
You may need to enable unknown source installation from settings before installing this app as it’s unavailable on the Play Store.
Step #5: Install Windows Exe Files
Until now, the ExaGear app must be installed on your phone. Now, we’re ready to install our Windows exe file on it.
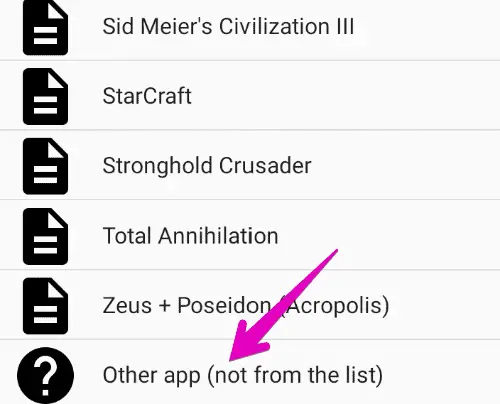
Launch this app > Tap three horizontal lines ☰ located at the top-left corner of the screen > Select Install New.
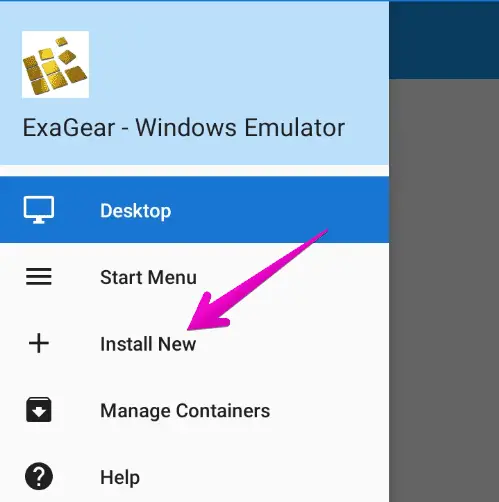
Swipe down and select Other app (not from the list) then, locate the exe file you want to install.
The installation process is the same as on a desktop PC.
If you face any error while installing the executable file, try downloading its lower version since it’s not able to install all heavy Windows software.
Step #6: Run The Installed Executable Program
Once the exe program installation process is completed, you can now run it on your Android device.
To do so, open the ExaGear app and you’ll find the installed exe files on the front.
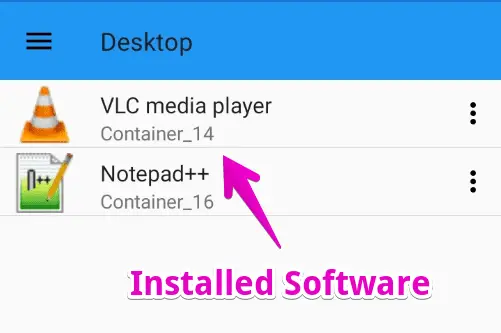
Just tap on it and the application will launch.
This way, you can easily run your favorite Windows programs directly on an Android device.
January 4, 2024
QChartist build 286 is out!
QChartist build 286 is out!
- new indicators: EhlersFourierTransform, istdevindicator (standard deviation indicator) and MogalefBands (uses the istdevonarray function)
- new indicator function: istdevonarray (stdev from array)
Please run update and recompile with QTStart
Enjoy!
December 26, 2023
QChartist build 285 is out!
QChartist build 285 is out!
- New Data Source
- Optimized systems in docs
- Hand cursor removed, the app no longer crashs, and the GUI is much more stable.
- Canvas bmp buffers debugged when undoing a drawing with a right-click
Please run update and recompile with QTStart
Enjoy!
December 11, 2023
Are you a freelance technical analyst ?
Are you a freelance technical analyst ?
Join my new Facebook group : https://facebook.com/groups/1063608981646278
#freelance #charting #stocks #stockmarket #crypto #BTC #Bitcoin #forex #FX #trading #finance #Ethereum #ETF #Indices
December 7, 2023
Your Turn To Multiply Dollars !
Your Turn To Multiply Dollars !
November 25, 2023
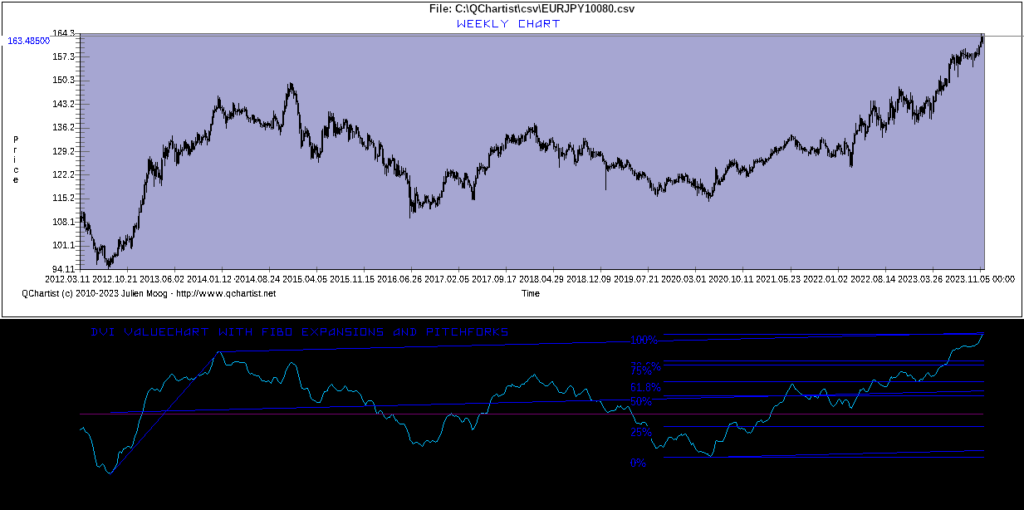
DVI_Valuechart indicator Weekly can be helpful
The DVI_Valuechart indicator on Weekly charts can be helpful to find major market reversals.
This indicator needs a volume information to work.
See the example below:
November 13, 2023
QChartist build 279 is out!
QChartist build 279 is out!
- Bug that limited the number of indicators solved. Now you can create and add new custom indicators, it won’t crash.
- New indicator : Anchored VWAP
- New indicator : Spud2
You can run update and recompile with QTStart
Enjoy!