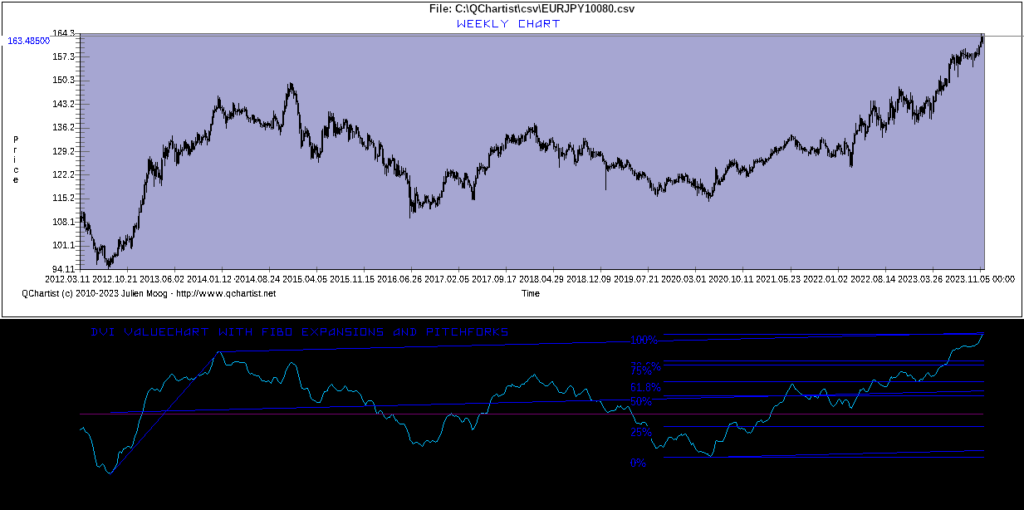
The DVI_Valuechart indicator on Weekly charts can be helpful to find major market reversals.
This indicator needs a volume information to work.
See the example below:
The DVI_Valuechart indicator on Weekly charts can be helpful to find major market reversals.
This indicator needs a volume information to work.
See the example below:
No comments yet.
RSS feed for comments on this post. TrackBack URL
Sorry, the comment form is closed at this time.
Powered by WordPress